<?xml version="1.0" encoding="UTF-8"?>
<feed xmlns="http://www.w3.org/2005/Atom">
  <!-- Source: https://planetscale.com/blog/feed.atom -->
  <title>Blog — PlanetScale</title>
  <subtitle>Posts about the PlanetScale platform, MySQL, PostgreSQL, databases, and more.</subtitle>
  <link href="https://siftrss.com/f/y6MV6p117oA"/>
  <link rel="alternate" type="text/html" hreflang="en" href="https://planetscale.com/blog"/>
  <link rel="self" type="application/atom+xml" href="https://siftrss.com/f/y6MV6p117oA"/>
  <id>https://siftrss.com/f/y6MV6p117oA</id>
  <updated>2026-09-01T00:00:00.000Z</updated>
  <entry>
    <title>How one connection kills a database</title>
    <link href="https://planetscale.com/blog/debugging-live-database-connections"/>
    <id>https://planetscale.com/blog/debugging-live-database-connections</id>
    <published>2026-08-31T00:00:00.000Z</published>
    <updated>2026-08-31T00:00:00.000Z</updated>
    <author>
      <name>Simeon Griggs</name>
    </author>
    <category term="product"/>
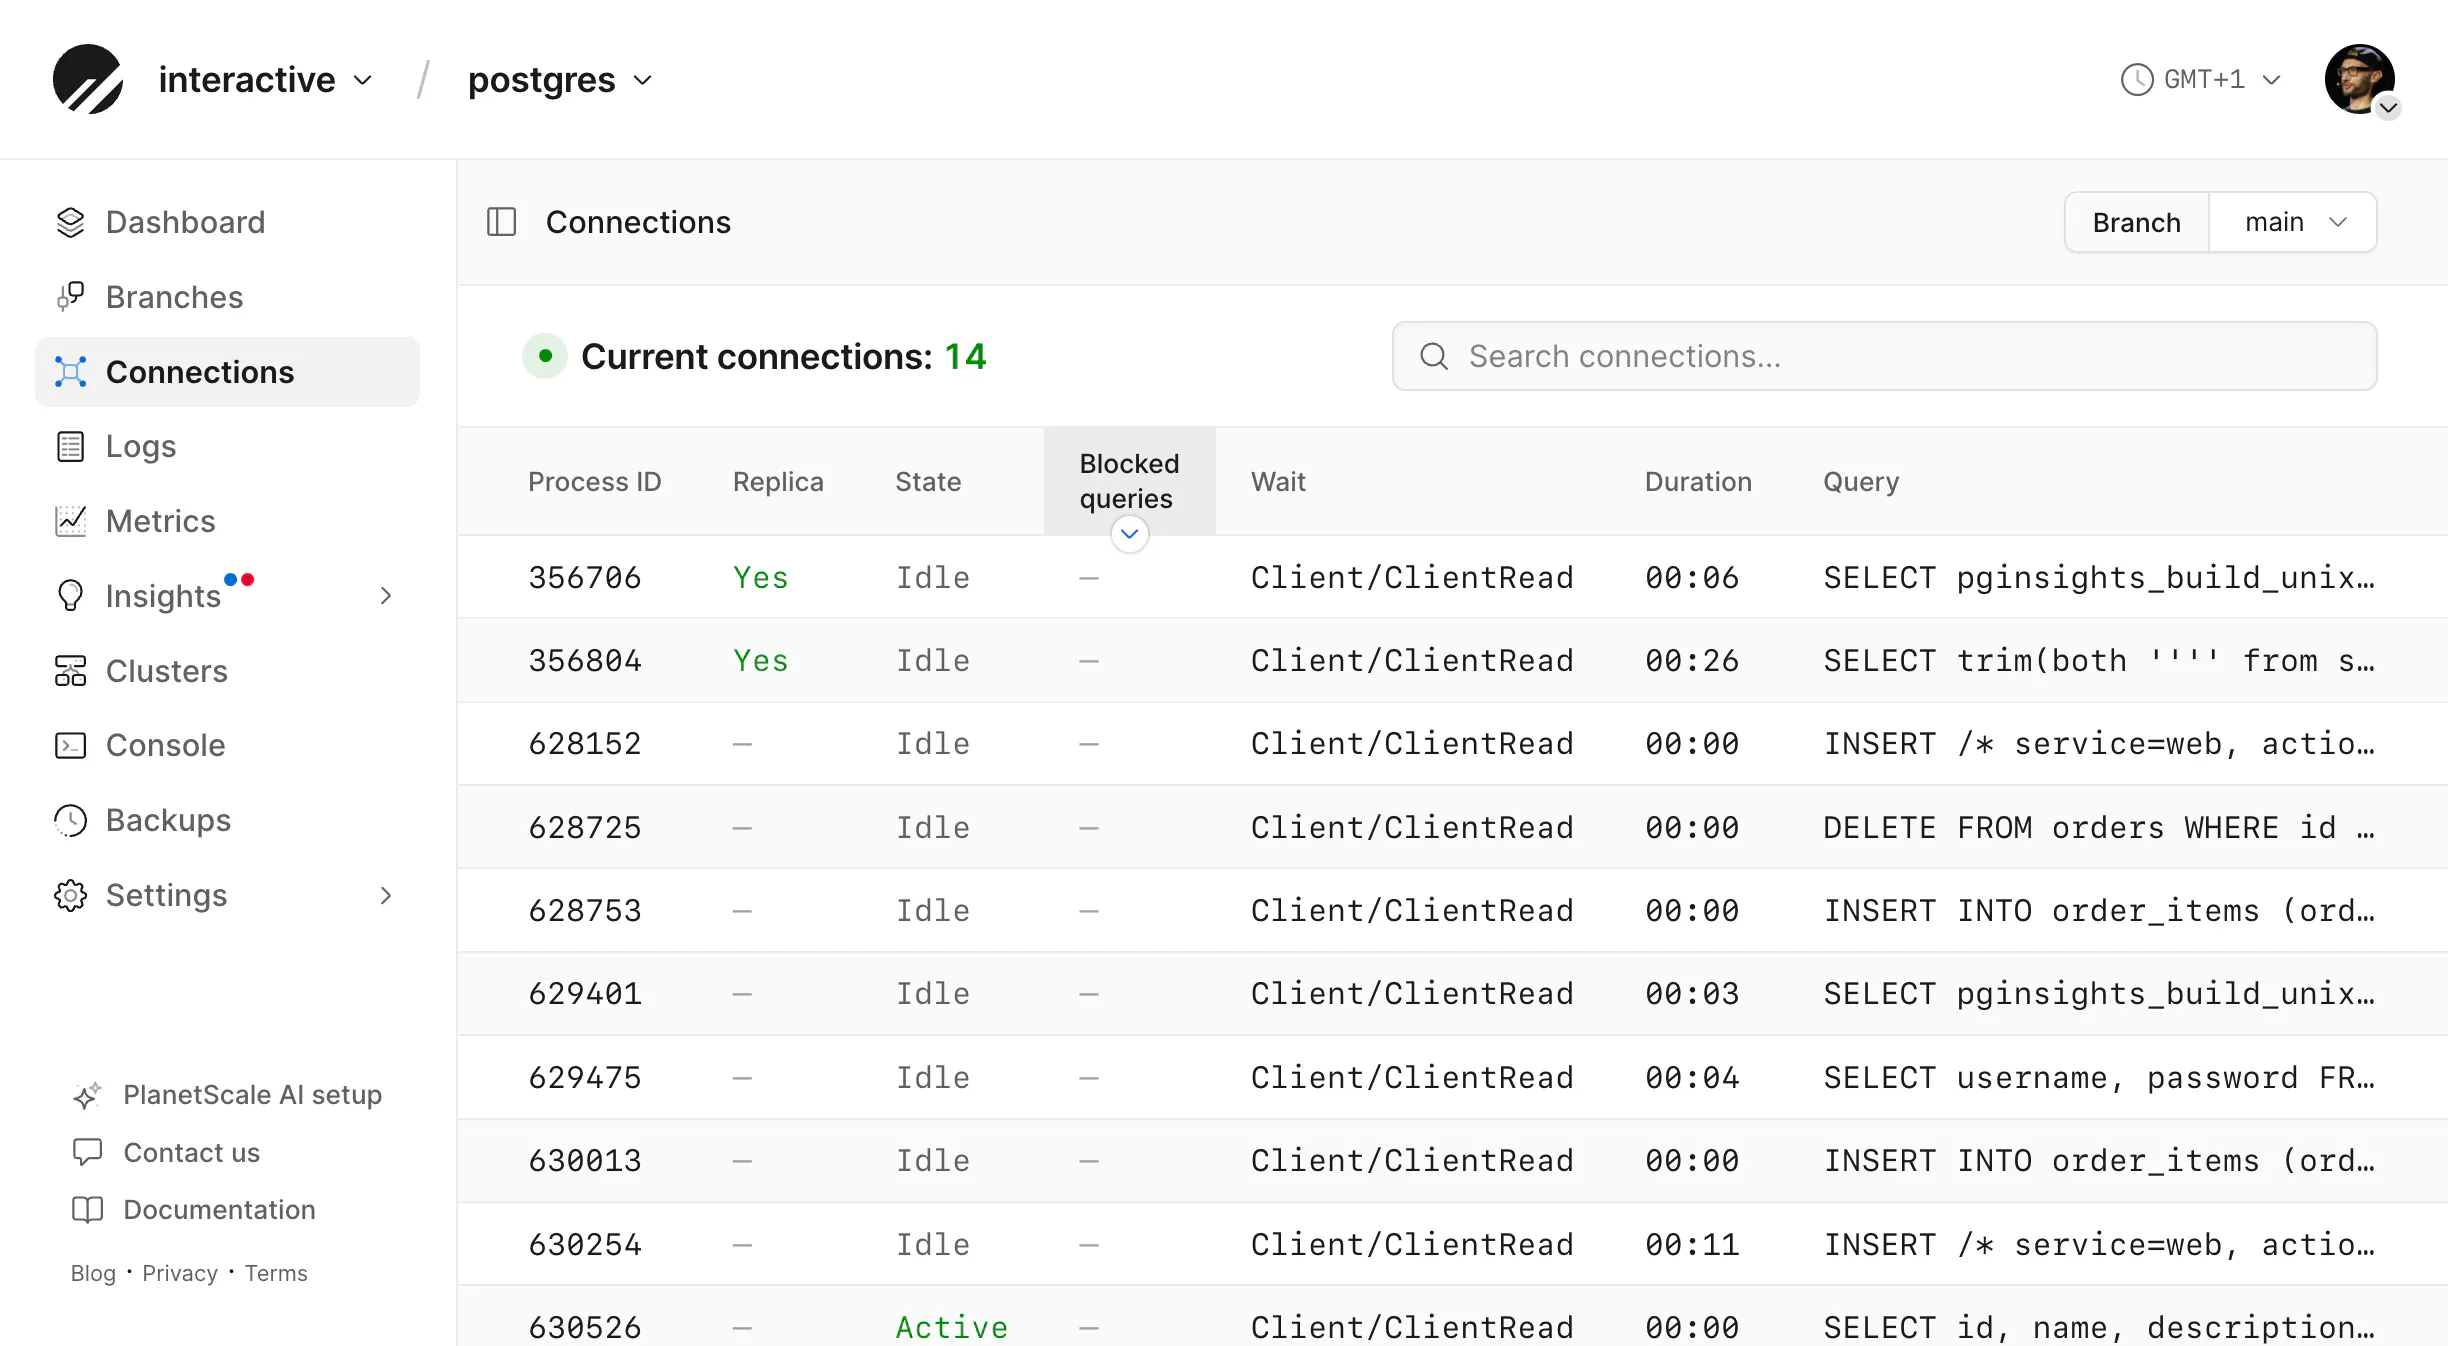
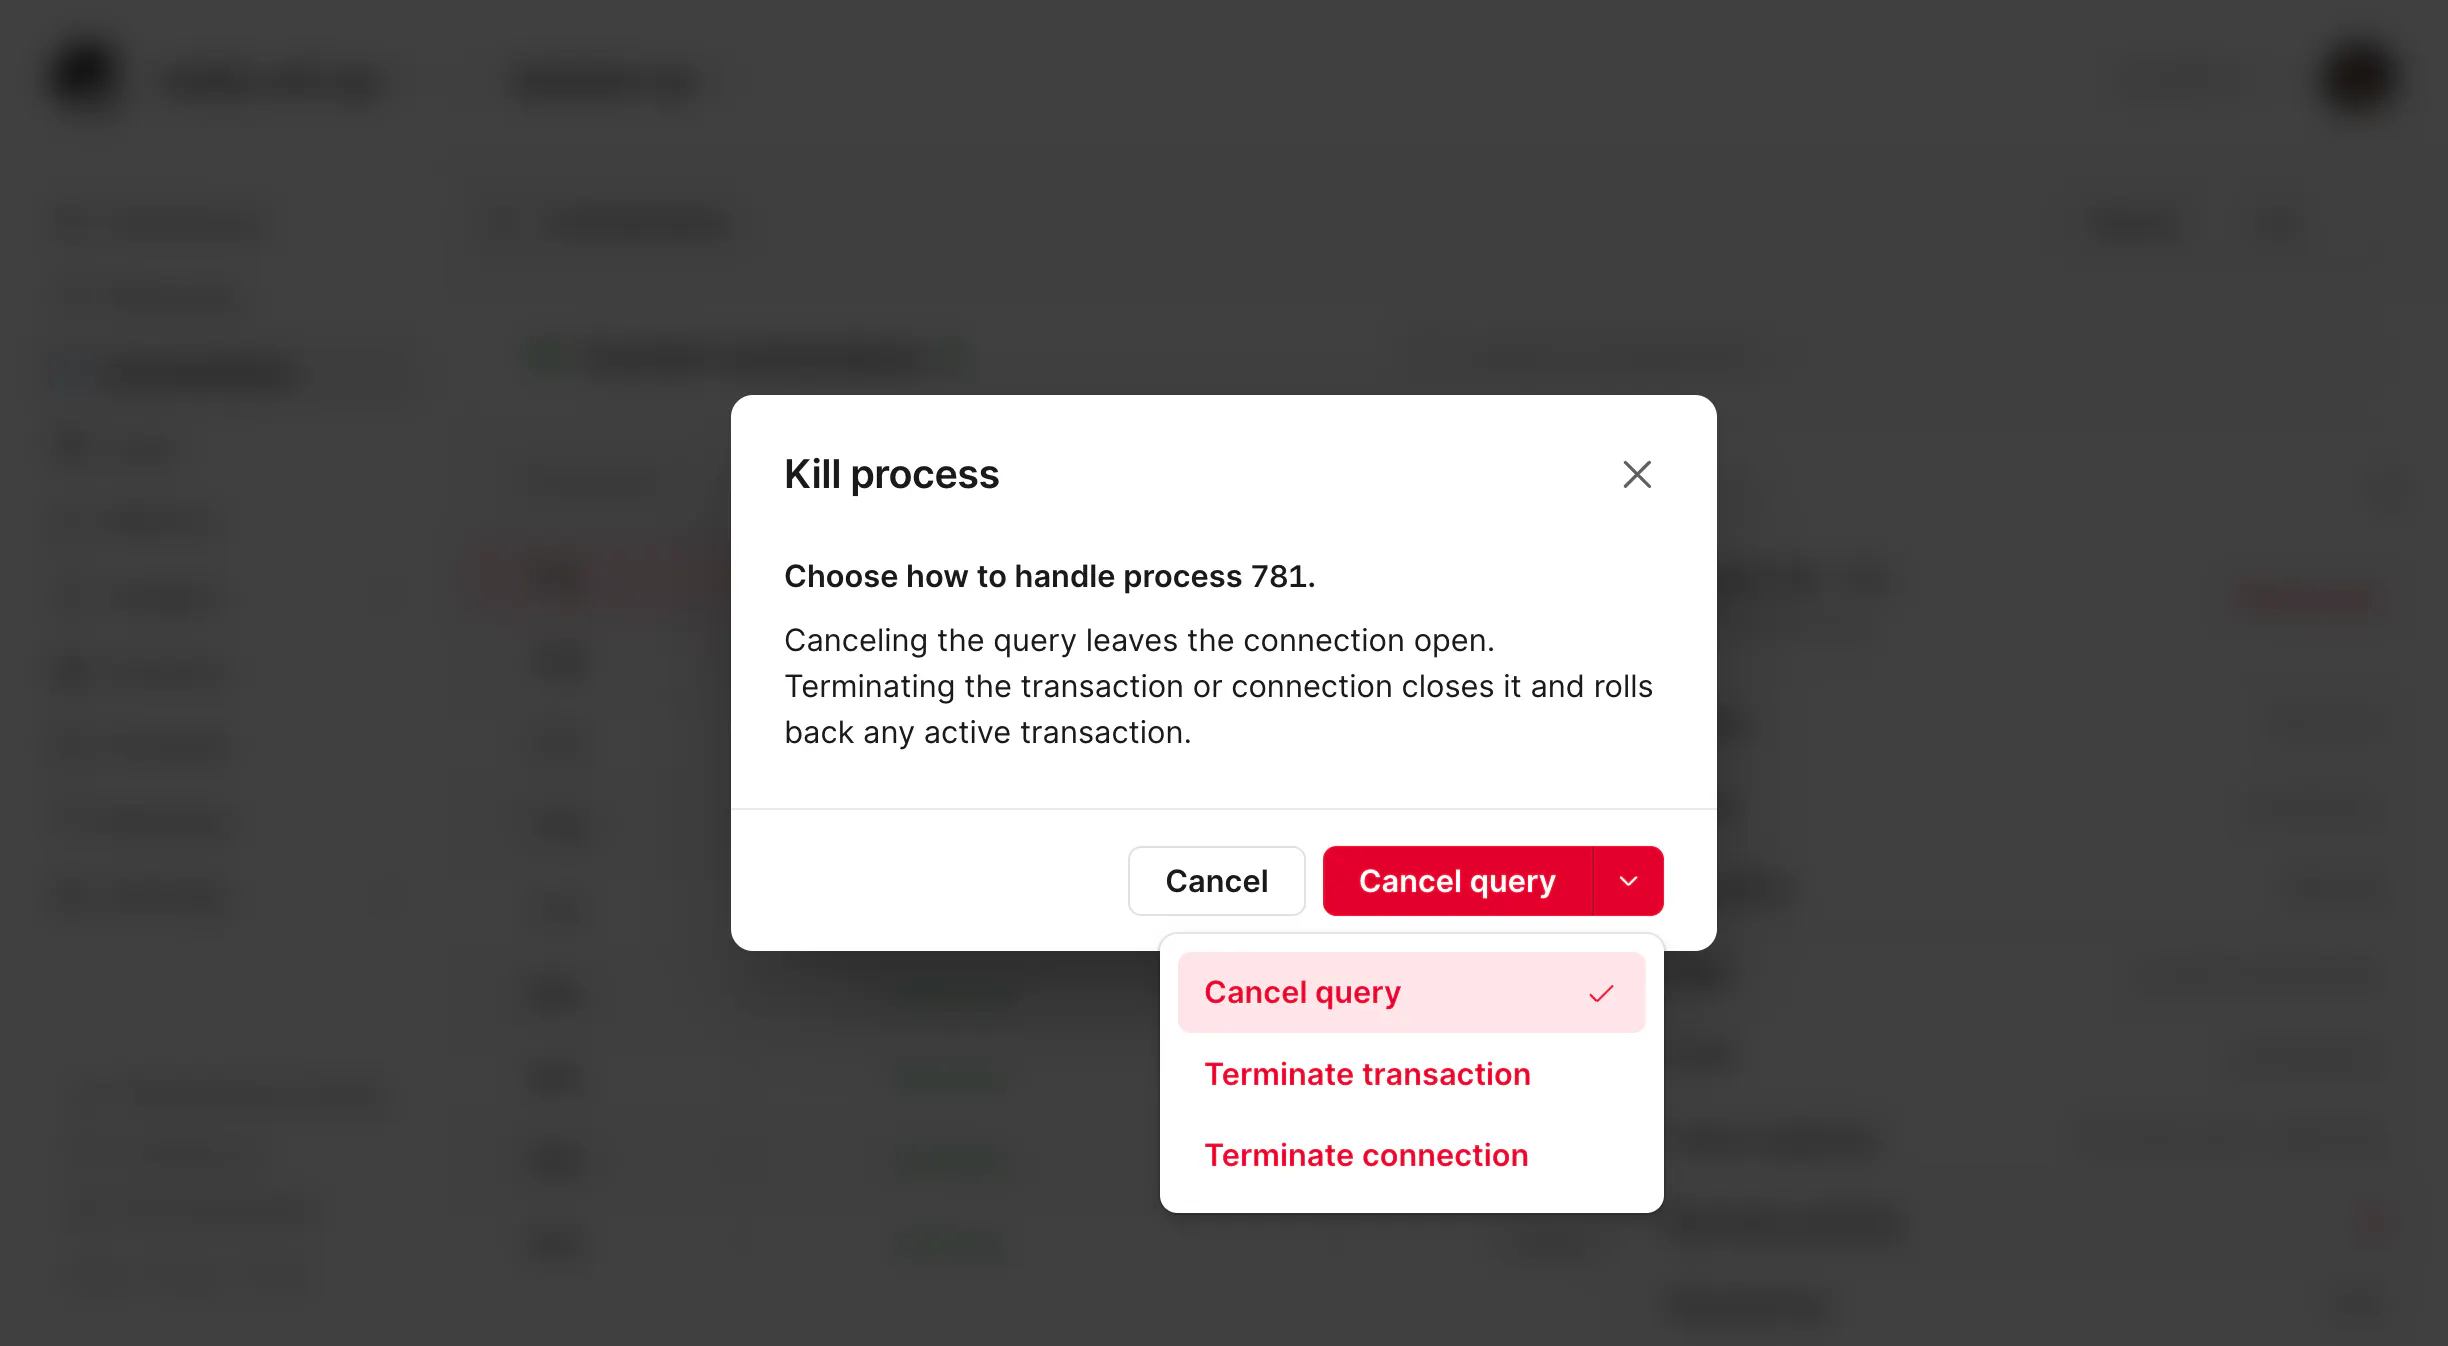
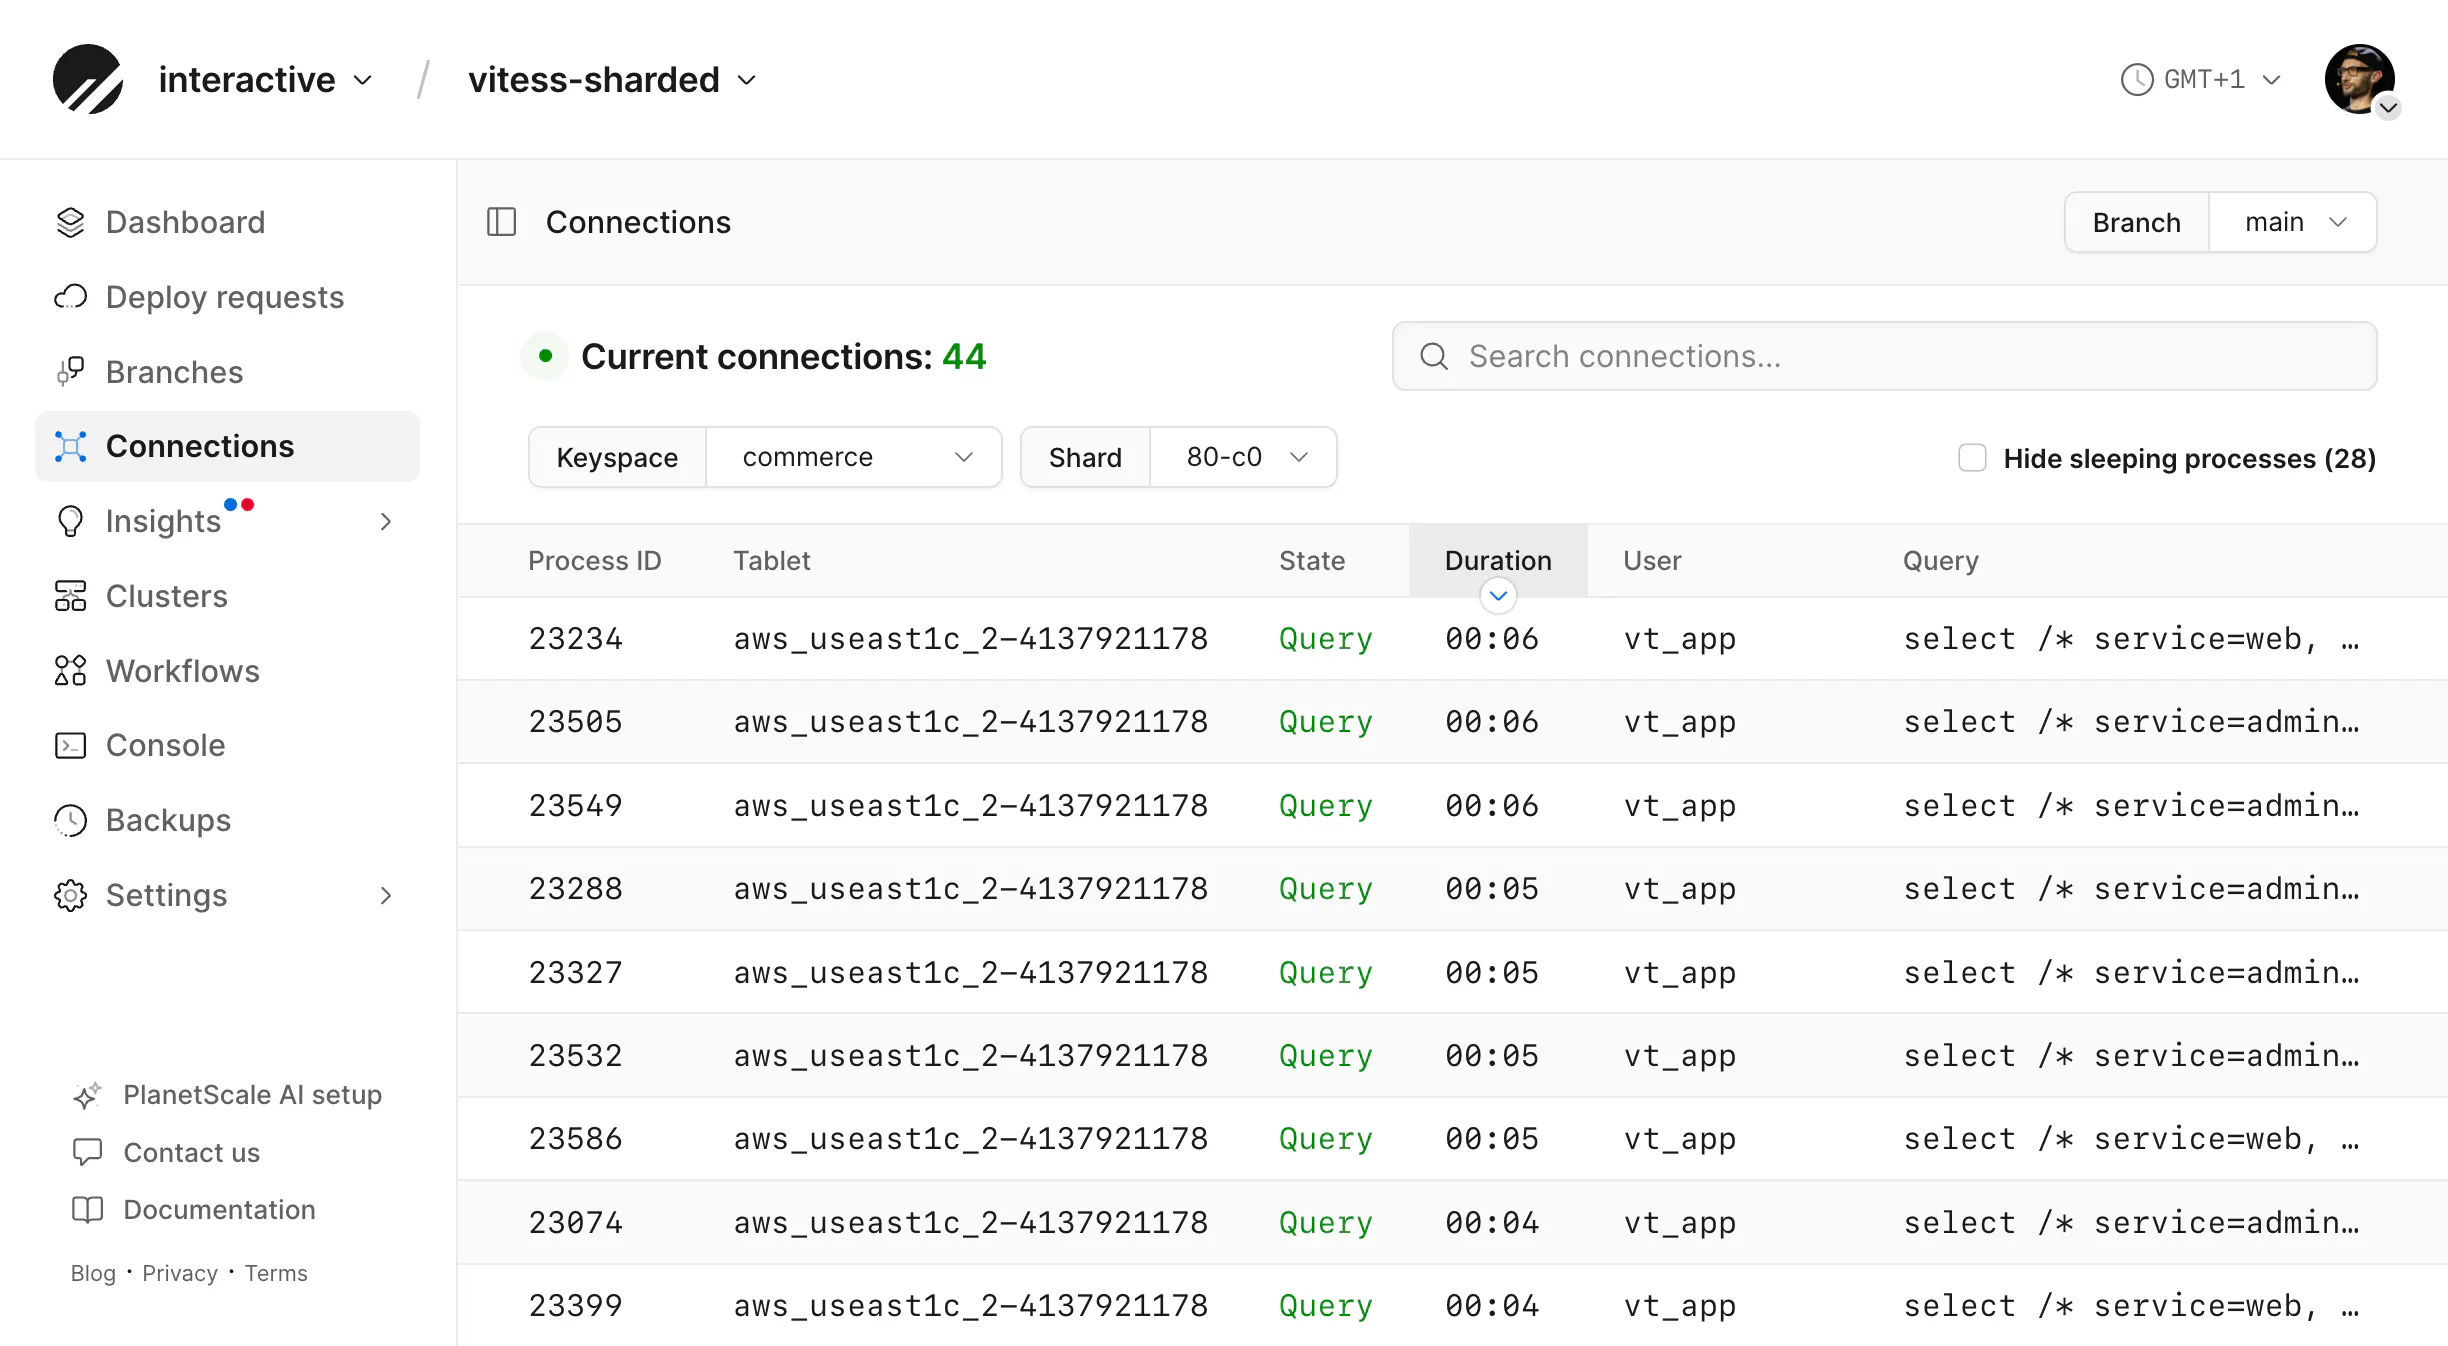
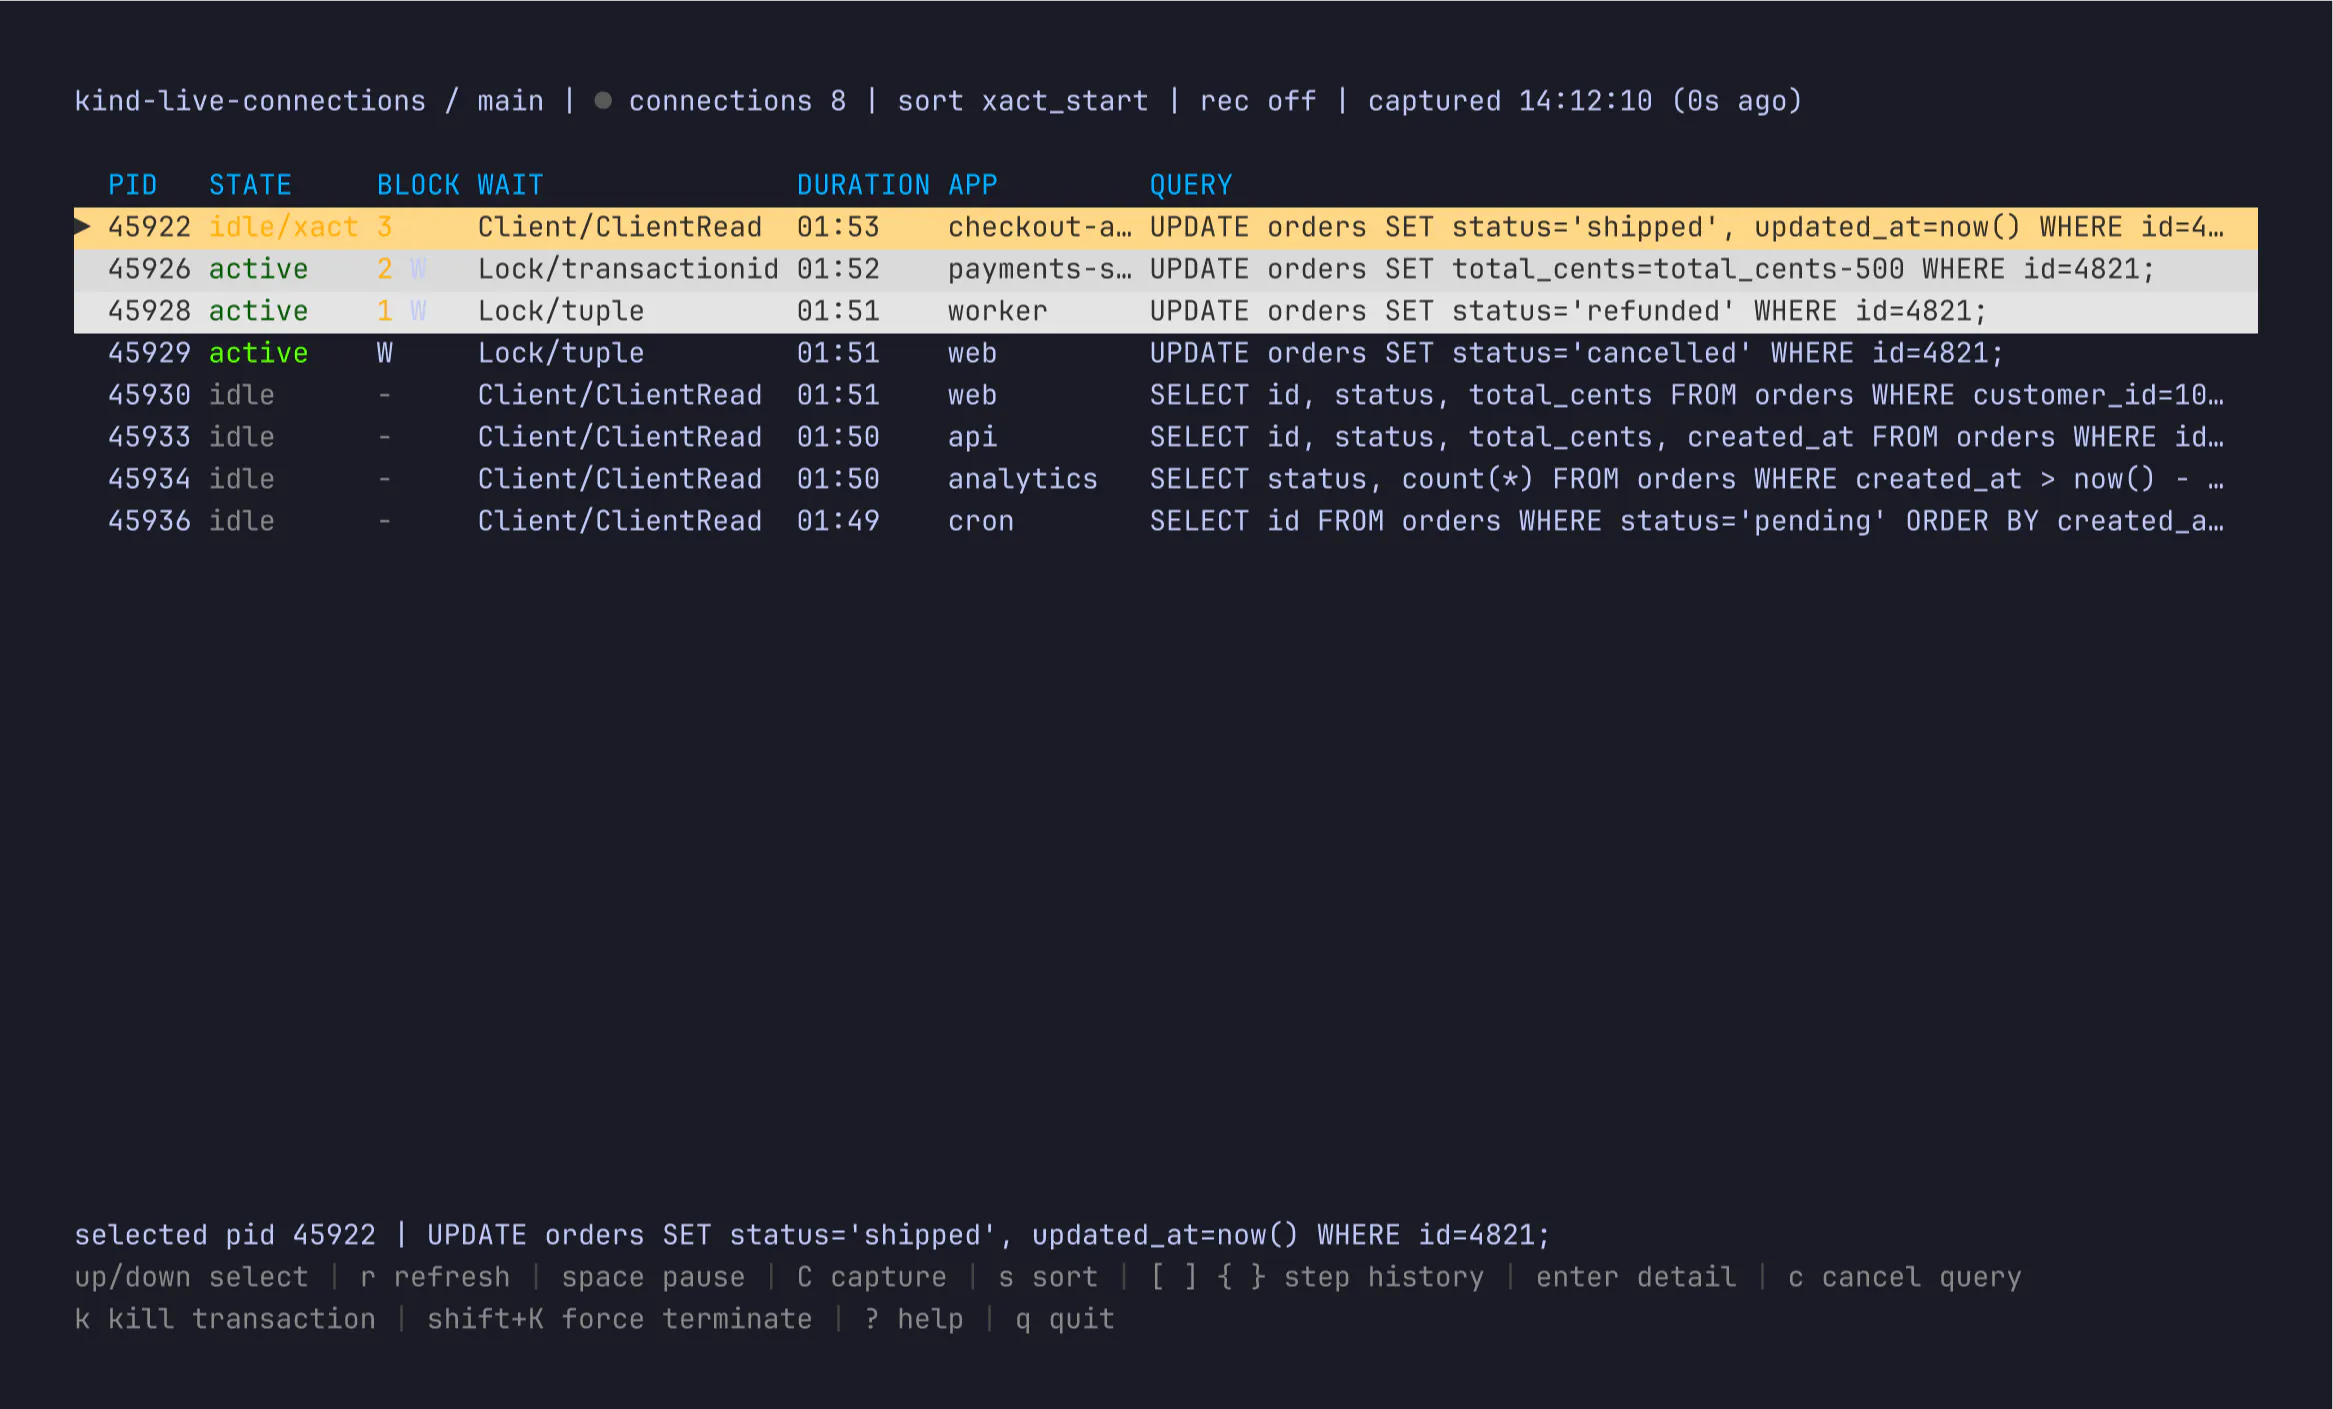
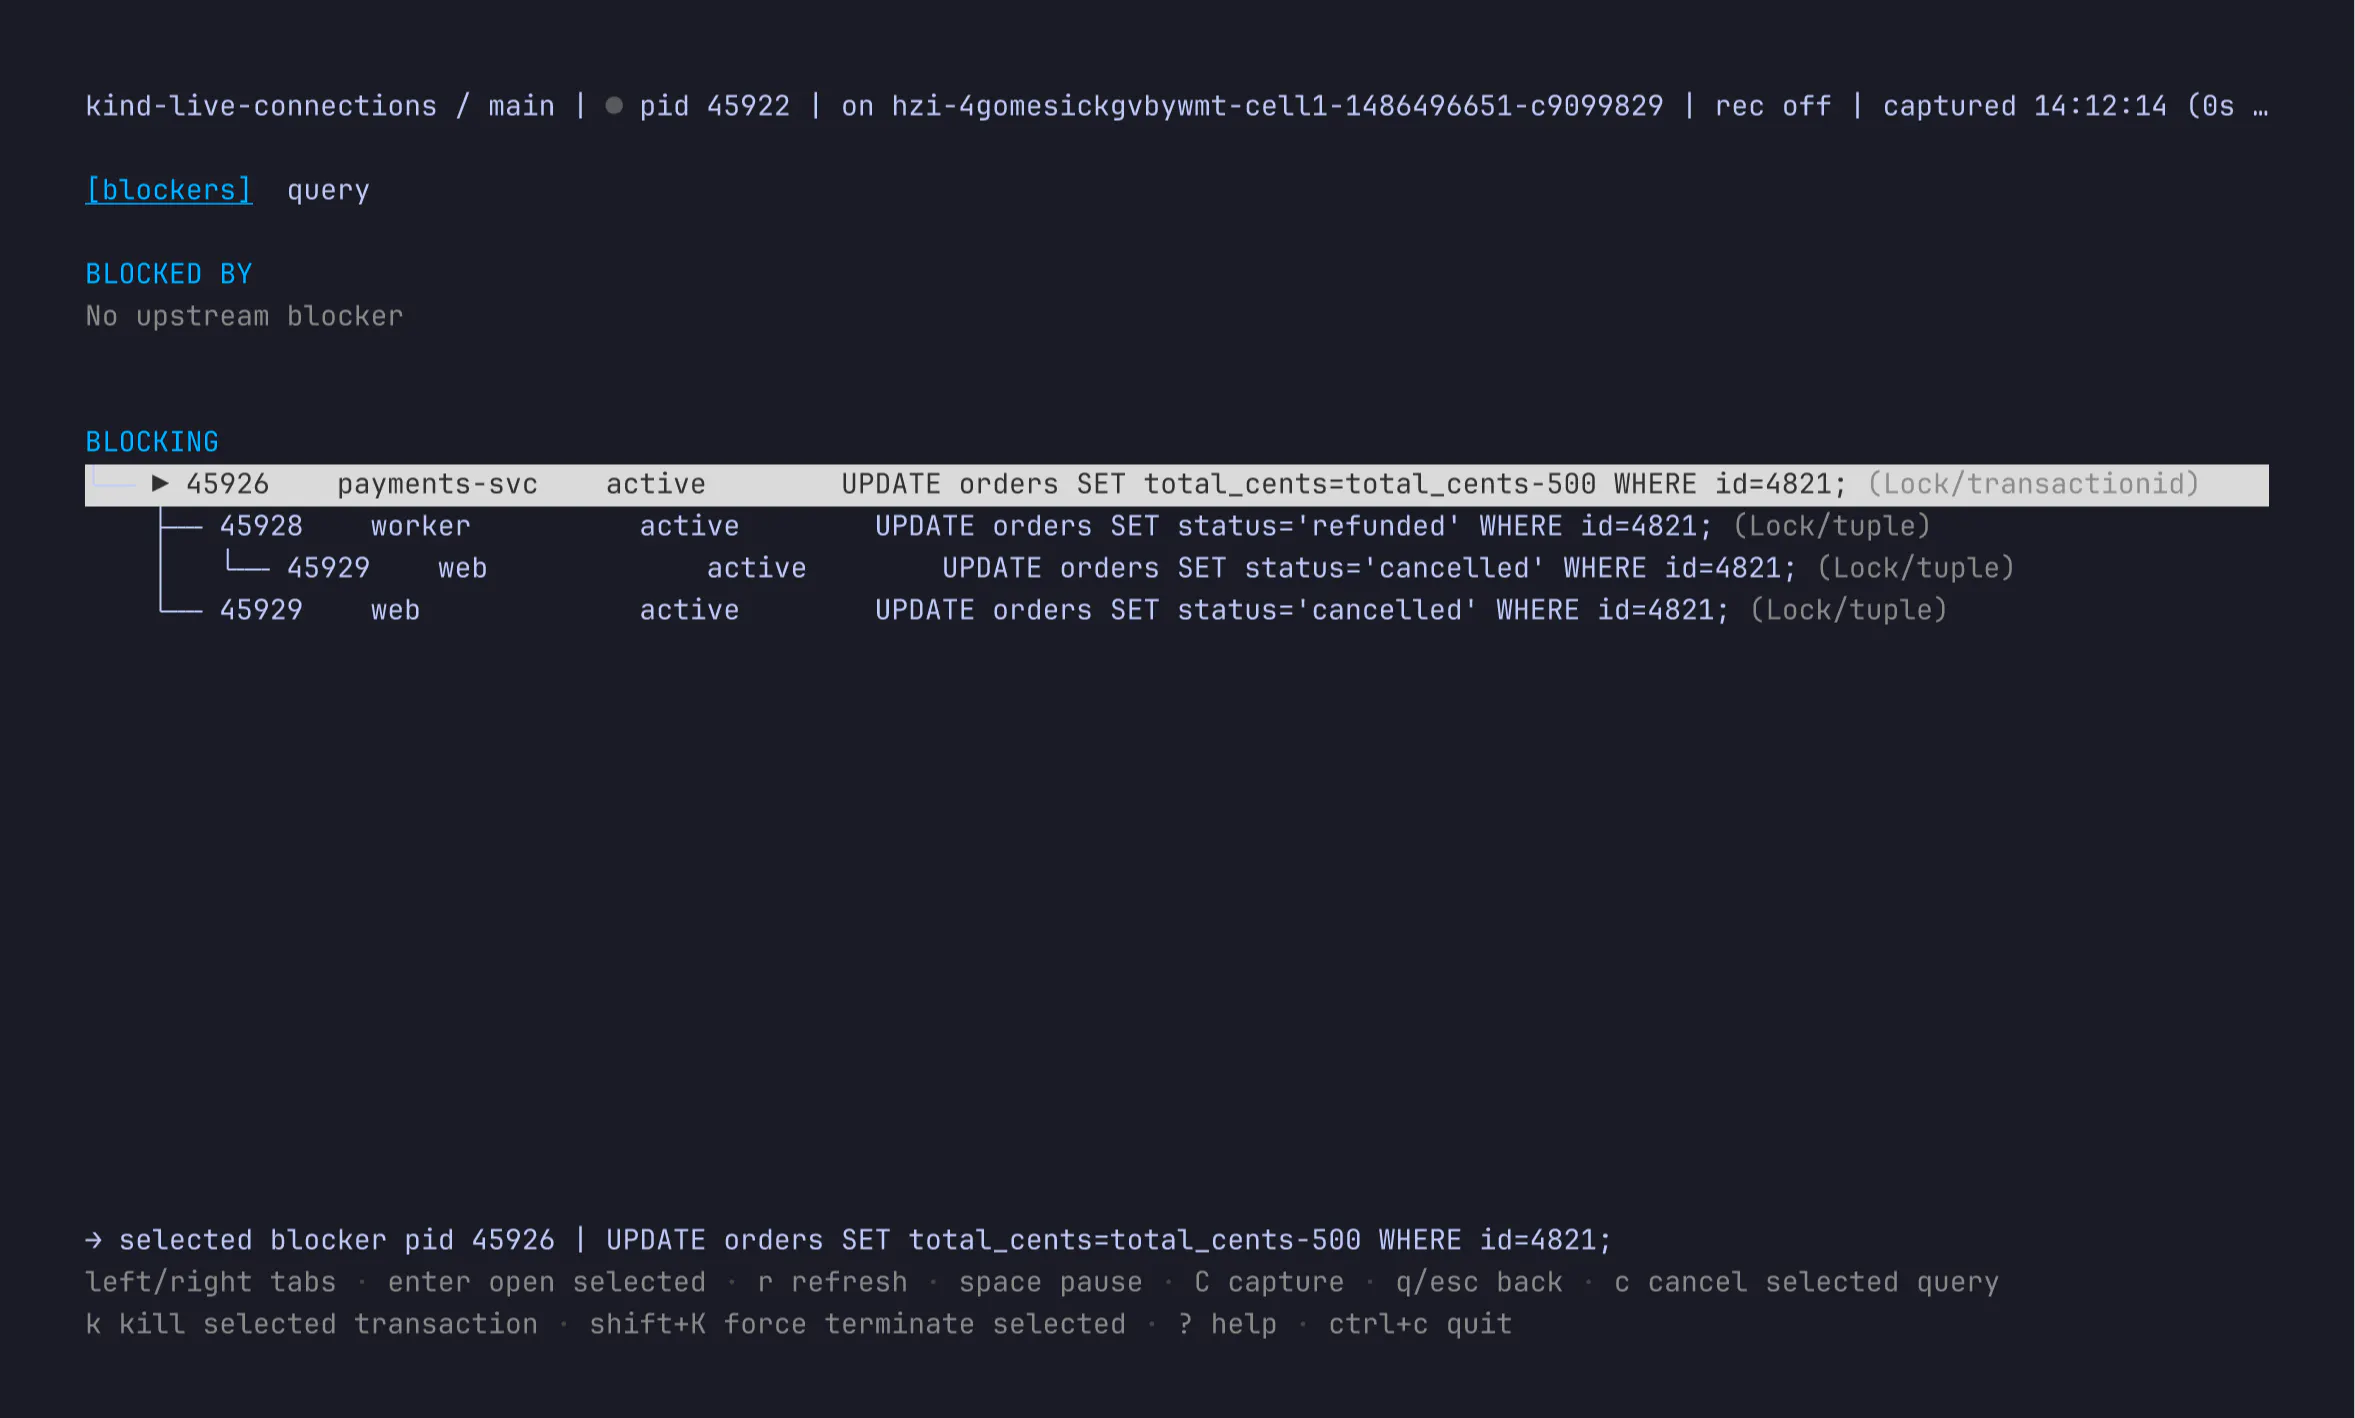
    <content type="html"><![CDATA[<p>Think you could land a DBA job at GitHub?</p><blockquote><p><em>You&#x27;ve just been paged. Every query is failing to execute. Find out why.</em></p></blockquote><p>Years ago at GitHub, this was a question <a href="https://x.com/samlambert">Sam Lambert</a> would ask in interviews.</p><p>The solution involved a downed database that started with a MySQL schema change needing an exclusive lock on a table, but it couldn&#x27;t get one. Another session had already touched that table and never committed. That open transaction blocked the schema change.</p><p>Once the schema change was waiting, new queries on the same table queued up behind it. Nothing was deadlocked. Nothing would time out on its own. The whole pile-up sat there until someone found the connection at the top of the chain and killed it.</p><p>(By the way, you&#x27;d avoid this MySQL lock on PlanetScale Vitess since <code>ALTER</code> would have been an online schema change, copying in the background and only taking a brief lock at cutover.)</p><p>This isn&#x27;t rare, and it isn&#x27;t exclusive to MySQL. You can reproduce the same pile-up on Postgres just as easily.</p><h2 id="want-to-see-a-stuck-database"><a href="https://planetscale.com/blog/debugging-live-database-connections#want-to-see-a-stuck-database">Want to see a stuck database?</a></h2><p>You won&#x27;t need elevated permissions. A normal application connection is enough.</p><p>All it takes is an unhandled exception and a poorly timed migration.</p><iframe src="https://planetscale.com/blog/debugging-live-database-connections/iframe#lock-queue" title="Interactive: a finished SELECT stays idle, a migration waits on it, and later queries queue behind the migration" loading="lazy"></iframe><p>Say you have a Postgres database with a hot table named <code>orders</code>.</p><p>On one <strong>connection</strong>, a <strong>transaction</strong> begins a <code>SELECT</code> <strong>query</strong>, but the app throws an exception.</p><div class="code-block" data-language="sql"><div class="min-w-0 max-w-full"><pre class="shiki shiki-themes planetscale-light planetscale-dark" style="--shiki-light:#2b2b2b;--shiki-dark:#e1e1e1;--shiki-light-bg:#ebebeb;--shiki-dark-bg:#1a1a1a" tabindex="0"><code><span class="line"><span style="--shiki-light:#818181;--shiki-dark:#A1A1A1">-- Connection A: Ordinary application user</span></span>
<span class="line"><span style="--shiki-light:#F35815;--shiki-dark:#F35815">BEGIN</span><span style="--shiki-light:#2B2B2B;--shiki-dark:#E1E1E1">;</span></span>
<span class="line"></span>
<span class="line"><span style="--shiki-light:#F35815;--shiki-dark:#F35815">SELECT</span><span style="--shiki-light:#F35815;--shiki-dark:#F35815"> *</span><span style="--shiki-light:#F35815;--shiki-dark:#F35815"> FROM</span><span style="--shiki-light:#2B2B2B;--shiki-dark:#E1E1E1"> orders </span><span style="--shiki-light:#F35815;--shiki-dark:#F35815">WHERE</span><span style="--shiki-light:#2B2B2B;--shiki-dark:#E1E1E1"> id </span><span style="--shiki-light:#F35815;--shiki-dark:#F35815">=</span><span style="--shiki-light:#D92038;--shiki-dark:#FF7082"> 123</span><span style="--shiki-light:#2B2B2B;--shiki-dark:#E1E1E1">;</span></span>
<span class="line"></span>
<span class="line"><span style="--shiki-light:#818181;--shiki-dark:#A1A1A1">-- ...then the app throws an exception 💀</span></span>
<span class="line"></span></code></pre></div></div><p>The <code>SELECT</code> <strong>query</strong> finished, but Postgres keeps holding the <strong>connection</strong>, waiting for the <strong>transaction</strong> to end with <code>COMMIT</code> or <code>ROLLBACK</code>, which it never does because of the app&#x27;s thrown exception.</p><p>While Postgres waits on that connection, another connection attempts to run a migration.</p><div class="code-block" data-language="sql"><div class="min-w-0 max-w-full"><pre class="shiki shiki-themes planetscale-light planetscale-dark" style="--shiki-light:#2b2b2b;--shiki-dark:#e1e1e1;--shiki-light-bg:#ebebeb;--shiki-dark-bg:#1a1a1a" tabindex="0"><code><span class="line"><span style="--shiki-light:#818181;--shiki-dark:#A1A1A1">-- Connection B: Migration role waiting on lock</span></span>
<span class="line"><span style="--shiki-light:#F35815;--shiki-dark:#F35815">ALTER</span><span style="--shiki-light:#F35815;--shiki-dark:#F35815"> TABLE</span><span style="--shiki-light:#2B2B2B;--shiki-dark:#E1E1E1"> orders </span><span style="--shiki-light:#F35815;--shiki-dark:#F35815">ADD</span><span style="--shiki-light:#2B2B2B;--shiki-dark:#E1E1E1"> COLUMN foo </span><span style="--shiki-light:#F35815;--shiki-dark:#F35815">integer</span><span style="--shiki-light:#2B2B2B;--shiki-dark:#E1E1E1">;</span></span>
<span class="line"></span></code></pre></div></div><p>The <code>SELECT</code> query only needed a read lock (<code>ACCESS SHARE</code>). The migration needs a lock that blocks all other access (<code>ACCESS EXCLUSIVE</code>), so it waits.</p><p>Postgres will not let later queries jump the queue. Every new query on <code>orders</code> waits behind the already-stuck migration, which is itself stuck behind the initial <code>SELECT</code> connection that never closed.</p><div class="code-block" data-language="sql"><div class="min-w-0 max-w-full"><pre class="shiki shiki-themes planetscale-light planetscale-dark" style="--shiki-light:#2b2b2b;--shiki-dark:#e1e1e1;--shiki-light-bg:#ebebeb;--shiki-dark-bg:#1a1a1a" tabindex="0"><code><span class="line"><span style="--shiki-light:#818181;--shiki-dark:#A1A1A1">-- Connections C, D, E, etc: Waiting on the lock</span></span>
<span class="line"><span style="--shiki-light:#F35815;--shiki-dark:#F35815">SELECT</span><span style="--shiki-light:#F35815;--shiki-dark:#F35815"> *</span></span>
<span class="line"><span style="--shiki-light:#F35815;--shiki-dark:#F35815">FROM</span><span style="--shiki-light:#2B2B2B;--shiki-dark:#E1E1E1"> orders</span></span>
<span class="line"><span style="--shiki-light:#F35815;--shiki-dark:#F35815">WHERE</span><span style="--shiki-light:#2B2B2B;--shiki-dark:#E1E1E1"> customer_id </span><span style="--shiki-light:#F35815;--shiki-dark:#F35815">=</span><span style="--shiki-light:#2B2B2B;--shiki-dark:#E1E1E1"> ?;</span></span>
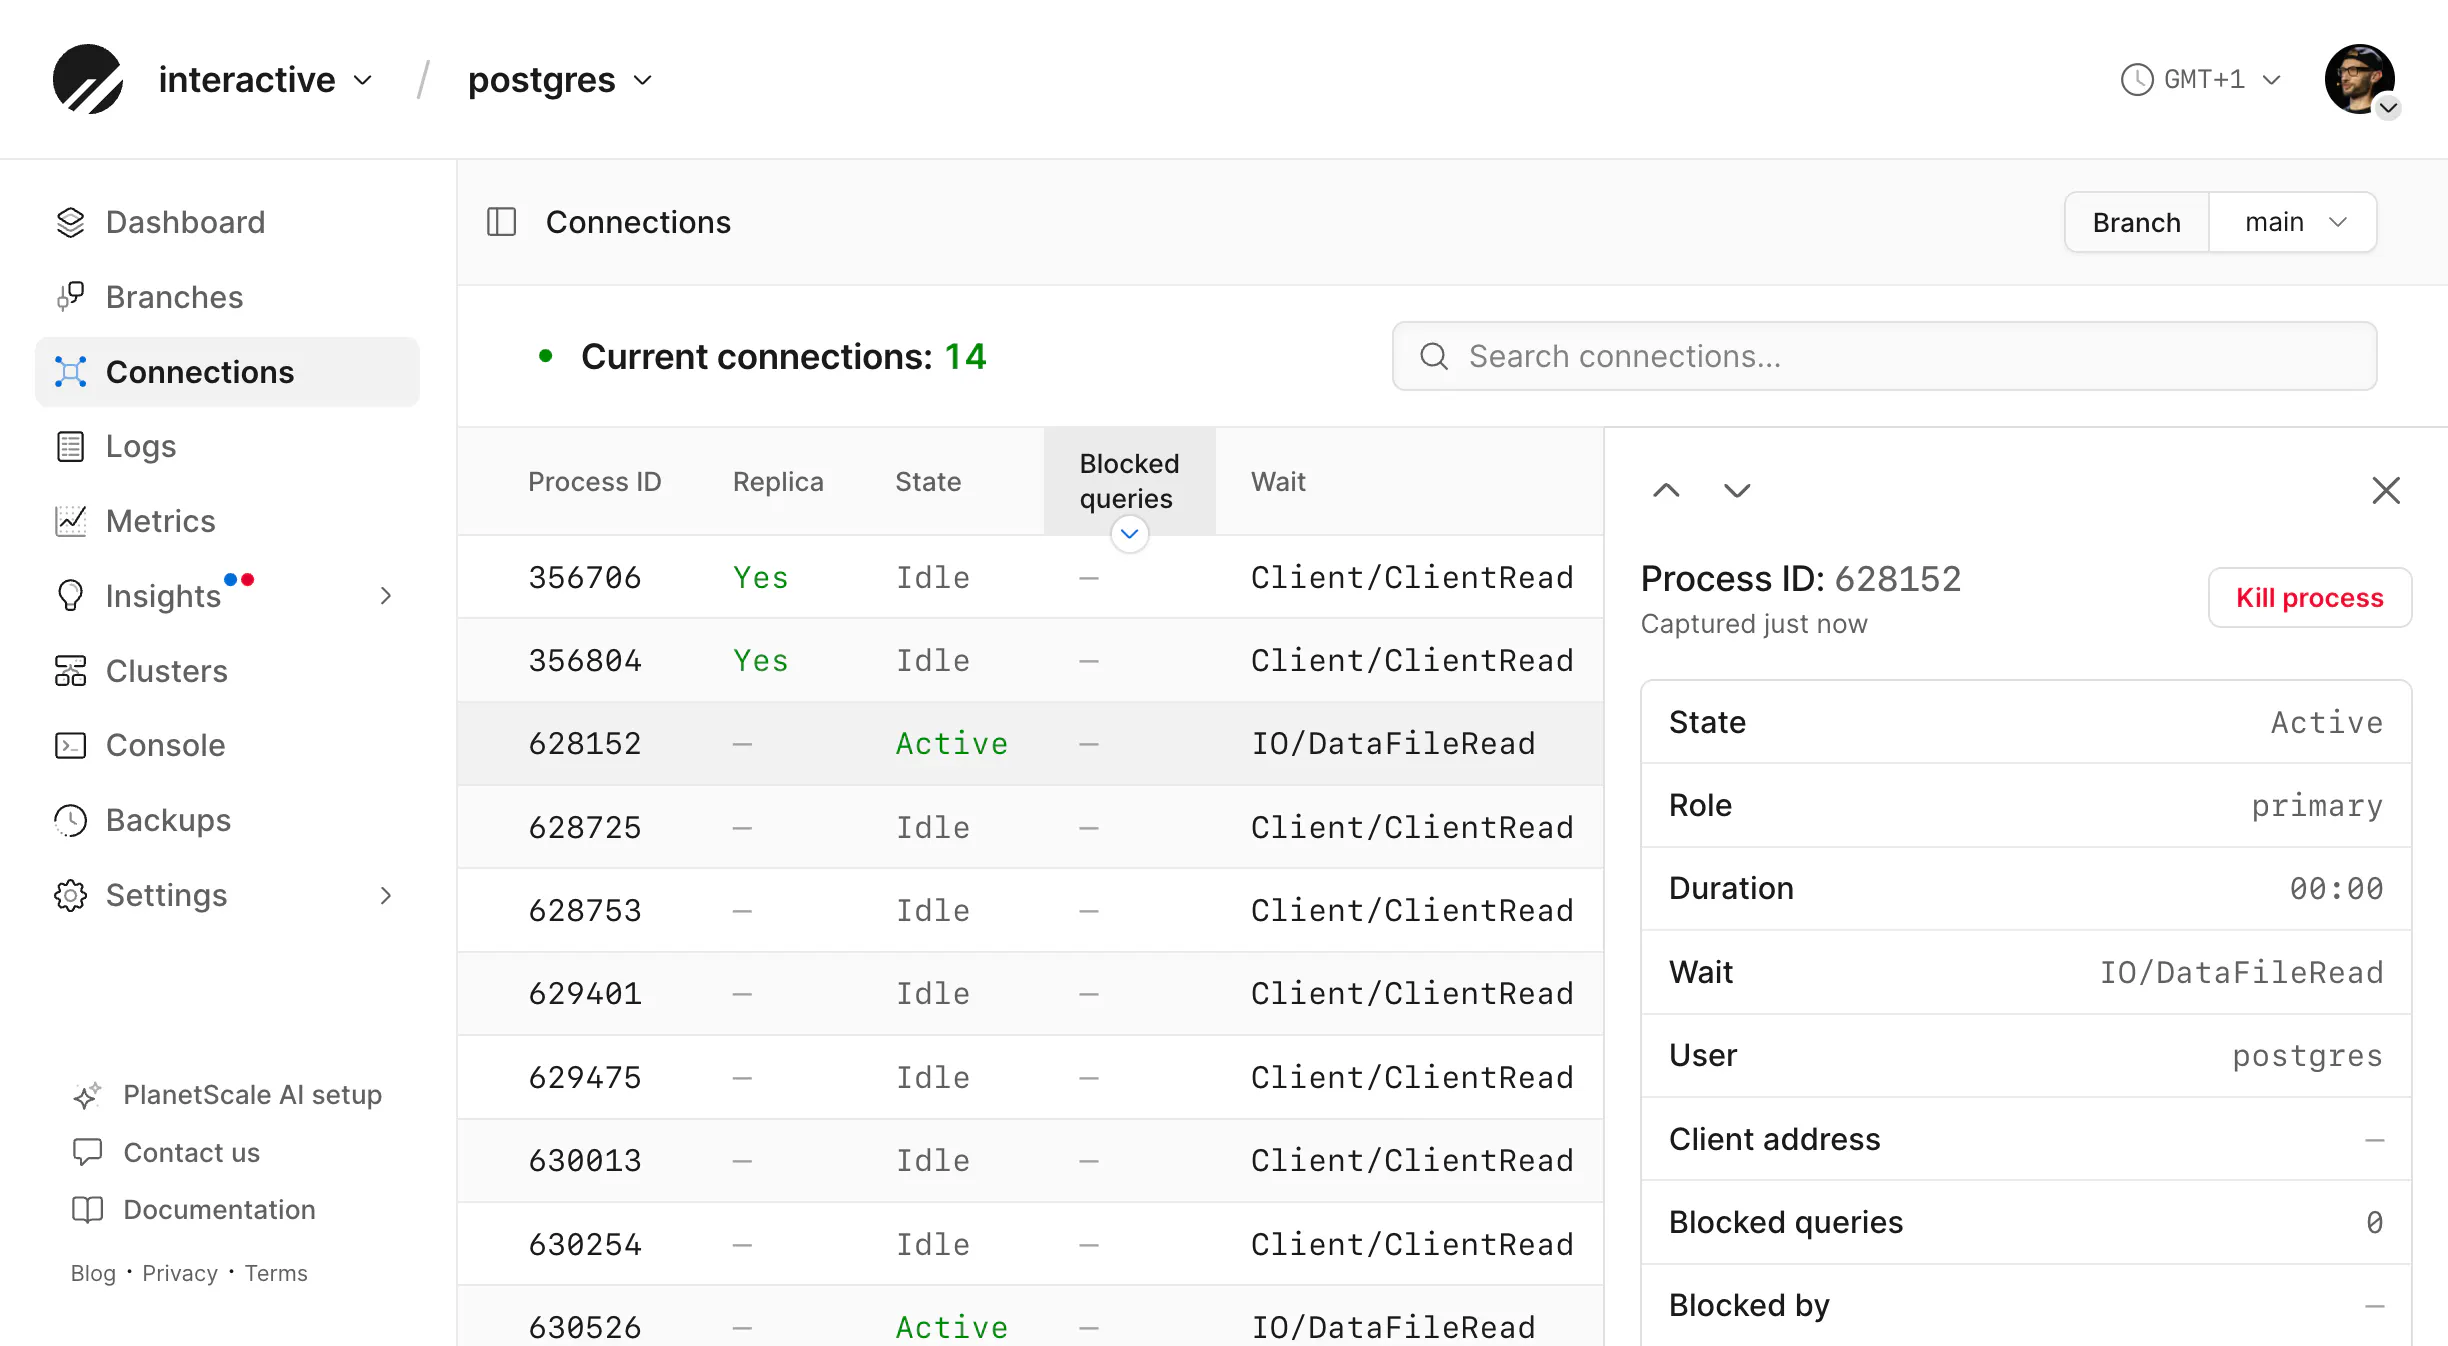
<span class="line"></span></code></pre></div></div><p>If the app doesn&#x27;t handle errors gracefully and depends on quick responses from <code>orders</code>, you&#x27;ve got downtime.</p><p>Not because of a hack, but because one unhandled exception prevented a <code>COMMIT</code>, kept a connection open, blocked a migration, and that migration blocked everything else.</p><p>By the way, this is preventable. It happens because the default for <code>idle_in_transaction_session_timeout</code> is disabled. Give it a value and Postgres times out transactions that haven&#x27;t closed.</p><h2 id="freeing-a-stuck-database"><a href="https://planetscale.com/blog/debugging-live-database-connections#freeing-a-stuck-database">Freeing a stuck database</a></h2><p>Debugging the state of connections in MySQL and Postgres can be clunky.</p><p>As covered in <a href="https://planetscale.com/blog/see-what-your-database-is-doing-right-now">See what your database is doing right now with Connections </a> it is possible to run a query on a loop in your terminal to see active connections. But it&#x27;s not an ideal interface.</p><p>It also depends on your database having spare connection slots. The worst-case scenario is your database is overwhelmed with connections that haven&#x27;t been closed, meaning even you can&#x27;t connect to debug and kill them.</p><p>Because this experience is so terrible, we&#x27;ve added the ability to view and kill connections in Postgres and MySQL databases on PlanetScale.</p><h2 id="connections-in-the-dashboard"><a href="https://planetscale.com/blog/debugging-live-database-connections#connections-in-the-dashboard">Connections in the dashboard</a></h2><p>PlanetScale&#x27;s connections tooling uses a reserved administrative connection so it can still show you a list of active connections and processes even when connections are exhausted and your application can&#x27;t connect.</p><p>In the PlanetScale dashboard, you can now click the Connections tab to view a live list of connections. You&#x27;ll see a bunch of useful columns like Process ID, State, and Duration, but most importantly, you will see a column for Blocked Queries.</p><p><picture class="block"><source media="(prefers-color-scheme: light), (prefers-color-scheme: no-preference)" srcSet="https://planetscale-images.imgix.net/assets/connections-pg-list-D9J8Ki6H.png?auto=compress%2Cformat"><source media="(prefers-color-scheme: dark)" srcSet="https://planetscale-images.imgix.net/assets/connections-pg-list-darkmode-DqWq7MBR.png?auto=compress%2Cformat"><img alt="The PlanetScale dashboard Connections list, with process ID, state, blocked queries, and query columns" src="https://planetscale-images.imgix.net/assets/connections-pg-list-D9J8Ki6H.png?auto=compress%2Cformat" width="2448" height="1346" loading="lazy"></picture></p><p>From here, it&#x27;s easy to see which connections are currently blocking others from proceeding. You can click into any connection to see more details, such as the query currently being performed by that connection.</p><p><picture class="block"><source media="(prefers-color-scheme: light), (prefers-color-scheme: no-preference)" srcSet="https://planetscale-images.imgix.net/assets/connections-pg-detail-B3YhOhsL.png?auto=compress%2Cformat"><source media="(prefers-color-scheme: dark)" srcSet="https://planetscale-images.imgix.net/assets/connections-pg-detail-darkmode-DDc7McTr.png?auto=compress%2Cformat"><img alt="The Connections detail panel for a selected process, with wait event, blocked queries, and a Kill process action" src="https://planetscale-images.imgix.net/assets/connections-pg-detail-B3YhOhsL.png?auto=compress%2Cformat" width="2448" height="1346" loading="lazy"></picture></p><p><strong>Kill process</strong> gives you three options, from least to most disruptive:</p><p><picture class="block"><source media="(prefers-color-scheme: light), (prefers-color-scheme: no-preference)" srcSet="https://planetscale-images.imgix.net/assets/connections-pg-kill-BBc_B223.png?auto=compress%2Cformat"><source media="(prefers-color-scheme: dark)" srcSet="https://planetscale-images.imgix.net/assets/connections-pg-kill-darkmode-CCIR1PwN.png?auto=compress%2Cformat"><img alt="The Kill process modal, with Cancel query, Terminate transaction, and Terminate connection" src="https://planetscale-images.imgix.net/assets/connections-pg-kill-BBc_B223.png?auto=compress%2Cformat" width="2448" height="1346" loading="lazy"></picture></p><ul><li><strong>Cancel query</strong> stops the running statement and leaves the connection open, so the app can send another query</li><li><strong>Terminate transaction</strong> rolls back the open transaction and closes the connection, but only if that same transaction is still running</li><li><strong>Terminate connection</strong> drops the backend entirely, whether it is idle or mid-query</li></ul><p>Thinking back to the downtime example, the idle <code>SELECT</code> had already finished, so canceling the query will not release the lock. In that scenario you would need to terminate the transaction or the connection.</p><p>Over on Vitess, each process has two options: cancel the query or terminate the connection. In a sharded database, you can view the process list per keyspace and shard.</p><p><picture class="block"><source media="(prefers-color-scheme: light), (prefers-color-scheme: no-preference)" srcSet="https://planetscale-images.imgix.net/assets/connections-vitess-list-Bd1fOrzO.png?auto=compress%2Cformat"><source media="(prefers-color-scheme: dark)" srcSet="https://planetscale-images.imgix.net/assets/connections-vitess-list-darkmode-ahtFt-ov.png?auto=compress%2Cformat"><img alt="The PlanetScale dashboard Connections list on a Vitess database, scoped to a keyspace and shard" src="https://planetscale-images.imgix.net/assets/connections-vitess-list-Bd1fOrzO.png?auto=compress%2Cformat" width="2448" height="1346" loading="lazy"></picture></p><h2 id="connections-via-cli"><a href="https://planetscale.com/blog/debugging-live-database-connections#connections-via-cli">Connections via CLI</a></h2><p>If you&#x27;d rather work with a terminal UI, launch:</p><div class="code-block"><div class="min-w-0 max-w-full"><pre class="shiki shiki-themes planetscale-light planetscale-dark" style="--shiki-light:#2b2b2b;--shiki-dark:#e1e1e1;--shiki-light-bg:#ebebeb;--shiki-dark-bg:#1a1a1a" tabindex="0"><code><span class="line"><span>pscale branch connections top &#x3C;database> &#x3C;branch></span></span>
<span class="line"><span></span></span></code></pre></div></div><p><picture class="block"><source media="(prefers-color-scheme: light), (prefers-color-scheme: no-preference)" srcSet="https://planetscale-images.imgix.net/assets/live-connections-top-DLKSy3CO.png?auto=compress%2Cformat"><img alt="The pscale branch connections top view, with a stuck checkout transaction at the top" src="https://planetscale-images.imgix.net/assets/live-connections-top-DLKSy3CO.png?auto=compress%2Cformat" width="2333" height="1409" loading="lazy"></picture></p><p>This opens an interactive live view that refreshes about once every second. The most important connections are sorted toward the top. You can navigate through the view using keyboard shortcuts and open any connection to see more details.</p><p><picture class="block"><source media="(prefers-color-scheme: light), (prefers-color-scheme: no-preference)" srcSet="https://planetscale-images.imgix.net/assets/live-connections-blockers-Dc1L2c1b.png?auto=compress%2Cformat"><img alt="The blocker tree: one idle checkout-api transaction holding up the refund, payment, and cancel updates queued behind it" src="https://planetscale-images.imgix.net/assets/live-connections-blockers-Dc1L2c1b.png?auto=compress%2Cformat" width="2355" height="1418" loading="lazy"></picture></p><p>If your agents prefer the current state of connections in JSON, use this one-shot command instead of the live view:</p><div class="code-block"><div class="min-w-0 max-w-full"><pre class="shiki shiki-themes planetscale-light planetscale-dark" style="--shiki-light:#2b2b2b;--shiki-dark:#e1e1e1;--shiki-light-bg:#ebebeb;--shiki-dark-bg:#1a1a1a" tabindex="0"><code><span class="line"><span>pscale branch connections show &#x3C;database> &#x3C;branch> --format json</span></span>
<span class="line"><span></span></span></code></pre></div></div><p>That output includes the IDs needed to cancel a query or terminate a connection, which you can still require confirmation for. See the <a href="https://planetscale.com/docs/cli/connections">CLI reference</a> for the kill commands that go with it.</p><h2 id="migrate-today-stress-less-later"><a href="https://planetscale.com/blog/debugging-live-database-connections#migrate-today-stress-less-later">Migrate today, stress less later</a></h2><p>The correct answer to land your dream job today is &quot;Use PlanetScale.&quot;</p><p>Next time you&#x27;re paged because everything is erroring, <a href="https://planetscale.com/migrate">I hope you&#x27;ve already migrated over</a>. The interview answer hasn&#x27;t changed, but connection management on PlanetScale has made it easier than ever before.</p>]]></content>
    <summary><![CDATA[Unblock stuck connections with live connection management in the PlanetScale CLI and dashboard]]></summary>
  </entry>
  <entry>
    <title>Problems with large tables in Postgres</title>
    <link href="https://planetscale.com/blog/dealing-with-large-tables-in-postgres"/>
    <id>https://planetscale.com/blog/dealing-with-large-tables-in-postgres</id>
    <published>2026-08-25T00:00:00.000Z</published>
    <updated>2026-08-25T00:00:00.000Z</updated>
    <author>
      <name>Simeon Griggs</name>
    </author>
    <category term="engineering"/>
    <content type="html"><![CDATA[<p>Tell me to stop when I name the largest table in your database: <code>logs</code>, <code>ledger</code>, <code>notifications</code>, <code>feed</code>, <code>events</code>, <code>chonk</code> ... admit it, I got it, right?</p><p>Product success leads to lots of data, lots of data leads to big tables, but big tables lead to predictable problems.</p><iframe src="https://planetscale.com/blog/dealing-with-large-tables-in-postgres/iframe#tables" title="Interactive: table sizes in an imagined database" loading="lazy"></iframe><p>A table can be large (many rows), wide (many columns), or &quot;fat&quot; (oversized values). Any of these can cause you problems.</p><h2 id="how-a-large-table-can-cause-an-outage"><a href="https://planetscale.com/blog/dealing-with-large-tables-in-postgres#how-a-large-table-can-cause-an-outage">How a large table can cause an outage</a></h2><p>First, let me tell you a story.</p><p>A customer had two tables, A and B. Table B is large and unpartitioned. It has a foreign key to A with cascade delete turned on. A single delete on A has to delete every child row in B. That can be 100s or 1000s of rows in B for every one in A.</p><p>In this customer&#x27;s case, deletions from A ran in a background job and attempted to remove around 100,000 rows from A. The deletes took so long that they timed out. The job retried. Each attempt generated a pile of WAL (the write-ahead log Postgres uses to record every change), which saturated the network and CPU between the primary and its replicas. This caused the replicas to lag.</p><p>The application checked replica LSN (a replica&#x27;s position in that WAL stream) before sending a read to a secondary. The secondaries were not caught up, so every query went to the primary.</p><p>The primary was already busy writing WAL. It also had to respond to all of the reads. And so a simple cascade delete on a large table quickly became an outage.</p><h2 id="possible-fixes-for-a-large-table"><a href="https://planetscale.com/blog/dealing-with-large-tables-in-postgres#possible-fixes-for-a-large-table">Possible fixes for a large table</a></h2><p>The problems covered in this post are common to all Postgres databases but are made worse by those containing large tables. You might reach for one of a few solutions, which we&#x27;ll examine throughout.</p><p><span class="bg-orange-100/80 text-orange-700 dark:bg-orange-800/70 dark:text-orange-200">Partitioning</span> splits a large table based on a key value. For example, if your large table stores rows with a specific date, such as when an event occurred, cutting that table into partitions of months or years creates more, smaller, and more manageable tables.</p><p>This can be useful for some large-table problems.</p><p><span class="bg-yellow-100/70 text-yellow-700 dark:bg-yellow-800 dark:text-yellow-300">Vertical scaling</span> refers to adding more resources to make more space or brute-forcing your way out of performance bottlenecks such as increasing CPU, RAM, or buying larger and faster disks.</p><p>It&#x27;s almost always a band-aid solution that only hides the real problem.</p><p><span class="bg-blue-100/80 text-blue-700 dark:bg-blue-800/80 dark:text-blue-300">Sharding (horizontal scaling)</span> splits the large table, or the entire database, into separate database clusters connected by a router to act as one. Just as Vitess is sharded MySQL, <a href="https://neki.dev/">Neki</a> is sharded Postgres.</p><p>With more, smaller, and isolated database clusters, almost all of your expected large table problems are resolved. More on that later in the post.</p><h2 id="slow-late-vacuum"><a href="https://planetscale.com/blog/dealing-with-large-tables-in-postgres#slow-late-vacuum">Slow, late vacuum</a></h2><p>You may already know that deleted rows in Postgres aren&#x27;t automatically removed; they are <em>marked</em> for deletion. These marked rows hold space until the vacuum process reclaims it. Read <a href="https://planetscale.com/blog/postgresql-mvcc">Every UPDATE leaves a ghost</a> to learn more.</p><p>What you might not realize is that vacuum runs <strong>per table</strong>.</p><iframe src="https://planetscale.com/blog/dealing-with-large-tables-in-postgres/iframe#vacuum" title="Interactive: small tables vacuum many times while one large table is still running" loading="lazy"></iframe><p>Vacuuming a single large table can tie up a worker for a long time. Vacuum uses a ring buffer so it does not evict the rest of <code>shared_buffers</code> (Postgres&#x27;s shared page cache), but on a table larger than RAM it still competes with user queries for the same disks.</p><p>Large tables take longer to vacuum, and they also wait longer to start.</p><p>On Postgres 17, the default trigger is 20% of the table. A table with ~500 million rows needs ~100 million dead tuples before autovacuum begins. You can modify this value cluster-wide or per table by changing <code>autovacuum_vacuum_scale_factor</code>.</p><p>Postgres 18 added <code>autovacuum_vacuum_max_threshold</code> with a default value of 100,000,000. So a billion-row table triggered autovacuum at 100 million (still a high number) instead of 200 million. Below 500 million rows, the old scale factor was still in play.</p><p><a href="https://planetscale.com/blog/whats-new-in-postgres-19">Postgres 19 adds parallel autovacuum</a>, <code>off</code> by default. Extra workers can finish one large table faster, but that still doesn&#x27;t change when vacuum starts.</p><p>Autovacuum also runs <code>ANALYZE</code>, which has the same default-doesn&#x27;t-scale problem. It samples a fixed number of rows no matter how large the table is. So the planner&#x27;s estimates potentially get worse as the table grows. Raise the target with <code>ALTER TABLE ... SET STATISTICS</code> on the columns the planner actually needs to get right.</p><p>Vacuum on large tables is late to start, slow to finish, with more dead rows while it runs. Each cycle is worse than the last, even when vacuum reports success.</p><p><span class="bg-orange-100/80 text-orange-700 dark:bg-orange-800/70 dark:text-orange-200">Partitioning</span> can be a good first move to split your large table into more reasonable-size chunks, if it has a suitable key.</p><p>Partitioning also helps avoid autovacuum&#x27;s late start. Each partition is its own smaller heap, so the 20% trigger fires after far fewer dead tuples. Workers vacuum partitions in parallel and <code>ANALYZE</code> samples a smaller relation.</p><div class="table-overflow"><table><thead><tr><th>Shape</th><th>Rows the formula sees</th><th>Default trigger (50 + 0.2 × rows)</th></tr></thead><tbody><tr><td>One heap, 500 million rows</td><td>500,000,000</td><td>~100,000,050 dead tuples</td></tr><tr><td>Same data as 12 monthly partitions</td><td>~41.7 million each</td><td>~8.3 million dead tuples per partition</td></tr></tbody></table></div><p>Disks and <code>shared_buffers</code> are still shared with the rest of the cluster, so it&#x27;s not a perfect solution.</p><p><span class="bg-yellow-100/70 text-yellow-700 dark:bg-yellow-800 dark:text-yellow-300">Vertical scaling</span> can help more workers finish sooner with faster disks. That does not change the trigger on one huge heap, and the table may still not fit in RAM.</p><p><span class="bg-blue-100/80 text-blue-700 dark:bg-blue-800/80 dark:text-blue-300">Sharding (horizontal scaling)</span> gives you the best of both worlds. Smaller tables on smaller databases, each with their own isolated resources.</p><p>Sharding also solves foundational parts of Postgres that can&#x27;t be resolved by more resources.</p><p>Every write transaction gets a 32-bit ID, and vacuum uses these IDs (<code>xmin</code>) to decide which row versions are still visible. These IDs are cluster-wide, not per-table. Vacuum freezes old tuples so XIDs can be reused; wraparound is the age of the oldest unfrozen XID (<code>relfrozenxid</code> in <code>pg_class</code>), not how many XIDs the database has ever issued. If that age reaches around 2.1 billion, Postgres goes into read-only mode. <a href="https://planetscale.com/blog/postgres-backups-under-the-hood#logical-backups-and-transaction-wraparound">Postgres backups under the hood</a> covers transaction wraparound in more detail.</p><p>Since each shard is its own cluster, a large table separated across shards is less likely to put a cluster into read-only mode.</p><p>Additionally with isolated I/O, any work vacuum does on one shard does not contend with queries on another. <code>ANALYZE</code> becomes a per-shard operation.</p><h2 id="wasted-time-on-incomplete-repacking"><a href="https://planetscale.com/blog/dealing-with-large-tables-in-postgres#wasted-time-on-incomplete-repacking">Wasted time on incomplete repacking</a></h2><p>Vacuum can be prevented from reclaiming space even if it finishes successfully.</p><iframe src="https://planetscale.com/blog/dealing-with-large-tables-in-postgres/iframe#repack" title="Interactive: vacuum needs three passes to reclaim every dead tuple" loading="lazy"></iframe><p>Vacuum can&#x27;t remove a dead tuple while any transaction in the cluster still needs it.</p><p>But a slow vacuum on a large table may have wasted its time to completion. Many of the rows it found to remove may still be required by transactions that started before vacuum finished and haven&#x27;t completed yet. Vacuum will need to walk the entire table again later.</p><p>This can be an issue on tables of any size, but is more annoying on large tables as they take longer to complete.</p><p>Free space that was successfully reclaimed can be reused for new rows, but the table file usually does not shrink. That leftover file size is bloat.</p><p>Should your table get bloated, PlanetScale Insights scans once a day and opens a recommendation when estimated bloat is over 25% and 100MB.</p><p>To compact a bloated table while reads and writes continue, enable <a href="https://planetscale.com/docs/postgres/extensions/pg_squeeze"><code>pg_squeeze</code></a> on the database&#x27;s Clusters page (that requires a restart), then run a one-time squeeze or register the table for regular cleanup.</p><p>Be aware that <code>pg_squeeze</code> has no throttle. Squeezing a large table can saturate I/O and CPU and cause an outage. Only run it when the cluster has spare capacity.</p><p><span class="bg-orange-100/80 text-orange-700 dark:bg-orange-800/70 dark:text-orange-200">Partitioning</span> creates more, smaller heaps. So a wasted pass is cheaper and can be retried sooner. Squeeze is per partition, so the spare disk you need to run squeeze is the size of a partition, not the whole table.</p><p>Splitting the table does not split the snapshot horizon. <code>xmin</code> is still cluster-wide, so a long query anywhere on the cluster still pins every partition.</p><p>You can drop old or bloated partitions instead of compacting them.</p><p><span class="bg-yellow-100/70 text-yellow-700 dark:bg-yellow-800 dark:text-yellow-300">Vertical scaling</span> adds more spare disk space, which may be the only reason squeeze can run at all and/or finish sooner. That lets you compact the same large file faster.</p><p><span class="bg-blue-100/80 text-blue-700 dark:bg-blue-800/80 dark:text-blue-300">Sharding</span> creates distinct Postgres database clusters, so a long query or dump on one shard doesn&#x27;t pin vacuum on any other. Squeeze runs only on the copy in its shard, not the entire large table. Each cluster tracks its own <code>xmin</code>.</p><p>In a sharded database, wasted vacuum passes are cheaper and less likely to happen.</p><h2 id="slow-queries-hold-connections-longer"><a href="https://planetscale.com/blog/dealing-with-large-tables-in-postgres#slow-queries-hold-connections-longer">Slow queries hold connections longer</a></h2><p>It is impossible to write a Postgres article about performance and not mention that <em>Postgres has a connection-per-process architecture</em>. Connection hygiene matters even more when your database has a large table.</p><iframe src="https://planetscale.com/blog/dealing-with-large-tables-in-postgres/iframe#connections" title="Interactive: two connections stuck on slow queries against events" loading="lazy"></iframe><p>Sequential scans (reading large segments of the table from start to finish), big sorts, and heavy joins against a large table take longer, so they hold connections longer.</p><p>Raising <code>max_connections</code> feels like a logical solution to avoid &quot;too many clients already,&quot; but this only lets more concurrent connections perform these slow queries. At best, this starves other workloads of new connections. At worst, a traffic spike on your large table is more likely to trigger an out-of-memory (OOM) event.</p><p>A large table will not stay in <code>shared_buffers</code>. More processes scanning it means more cache eviction, more disk usage, slower queries, and longer-held connections.</p><p><span class="bg-orange-100/80 text-orange-700 dark:bg-orange-800/70 dark:text-orange-200">Partitioning</span> splits your large table, which can help queries finish faster (and release connections sooner) so long as they access only one or a few partitions. But cross-partition queries can get worse.</p><p>Buy all the RAM and CPU you like with <span class="bg-yellow-100/70 text-yellow-700 dark:bg-yellow-800 dark:text-yellow-300">vertical scaling</span>, but you&#x27;re still not putting a hundreds-of-GB table into cache. You cannot spend your way out of inefficient connection handling.</p><p><span class="bg-blue-100/80 text-blue-700 dark:bg-blue-800/80 dark:text-blue-300">Sharding</span> spreads your backends across multiple clusters, where each shard-distinct query is shorter and more likely cached.</p><p>A connection held by a large table is one the rest of the product cannot use. With workloads spread across shards there may be less overlap.</p><p>A scatter-gather query with no shard key can hold more connections, not fewer. Selecting the right key to shard on is critical to seeing performance benefits from sharding.</p><h2 id="slower-backups-and-recovery"><a href="https://planetscale.com/blog/dealing-with-large-tables-in-postgres#slower-backups-and-recovery">Slower backups and recovery</a></h2><p>Postgres gives you three ways to take a backup. A large table complicates each one in a unique way.</p><iframe src="https://planetscale.com/blog/dealing-with-large-tables-in-postgres/iframe#backups" title="Interactive: copying a large table looks busy but barely makes progress" loading="lazy"></iframe><p>A logical dump with <code>pg_dump</code> writes live rows, so dead tuples stay out of the output. The dump still walks the bloated heap, and it holds a transaction snapshot the whole time. On a small table, that pin is brief. On a large table, the backup is a long-running transaction against the cluster.</p><p>A file system backup copies the data directory, bloat and all. Faster than dumping rows. A consistent copy usually means shutting the database down, or relying on atomic snapshots from the file system. You might be okay with a maintenance window for a database of small tables, but a single large table could add hours just to copy one relation.</p><p>Continuous archiving copies the data files while Postgres is still running, then keeps the WAL so you can replay through the modified bits and land on a consistent copy. No dump pin, no shutdown. You still copy the large table, bloat, and its indexes. What grows with the table is restore time. How long an incident waits on this heap plus the WAL written while the copy ran.</p><p>That third option is <a href="https://planetscale.com/blog/postgres-backups-under-the-hood">how PlanetScale backs up Postgres</a>. We copy the data files and continuously archive WAL on a throwaway node rather than on your primary, so the backup doesn&#x27;t compete with production queries for disk and doesn&#x27;t pin the primary.</p><p>We can&#x27;t skip the size of those files. A large table that doesn&#x27;t fit in memory, plus its indexes, plus its bloat, is what has to land in object storage.</p><p><span class="bg-orange-100/80 text-orange-700 dark:bg-orange-800/70 dark:text-orange-200">Partitioning</span> rearranges files but doesn&#x27;t shrink the copy. A pin held during dump is still cluster-wide. A physical backup includes the same bloat even if it is split across smaller tables.</p><p><span class="bg-yellow-100/70 text-yellow-700 dark:bg-yellow-800 dark:text-yellow-300">Vertical scaling</span> means faster copies through more resources. But the files aren&#x27;t any smaller, so restore is only quicker because the disks are faster.</p><p>But neither partitioning nor vertical scaling changes the <em>size</em> of the data.</p><p><span class="bg-blue-100/80 text-blue-700 dark:bg-blue-800/80 dark:text-blue-300">Sharding</span> breaks down backups and restores into smaller, distinct units of work, allowing them to complete much faster. Recovery time depends on the slowest shard instead of the largest table.</p><h2 id="too-many-indexes"><a href="https://planetscale.com/blog/dealing-with-large-tables-in-postgres#too-many-indexes">Too many indexes</a></h2><p>A large table isn&#x27;t viable to scan from start to finish and is likely queried in many different ways.</p><iframe src="https://planetscale.com/blog/dealing-with-large-tables-in-postgres/iframe#indexes" title="Interactive: indexes keep accumulating until they push the events table off the page" loading="lazy"></iframe><p>To keep queries fast, you keep adding indexes to the table. While indexes make queries fast, they aren&#x27;t free. They take disk, get vacuumed, get backed up, and make every write touch more files.</p><p>There are no good options here. Prune indexes and your queries get slower. Accumulate indexes and pay for it with an enlarged heap, while also vacuuming, packing, and copying many access paths.</p><p>The indexes that make a large table usable are part of what makes it too large to keep indexing.</p><p>Indexes on a <span class="bg-orange-100/80 text-orange-700 dark:bg-orange-800/70 dark:text-orange-200">partitioned</span> table are created on the logical table but stored and updated on each partition. Those smaller indexes are faster to build and cheaper to <code>REINDEX</code>.</p><p><span class="bg-yellow-100/70 text-yellow-700 dark:bg-yellow-800 dark:text-yellow-300">Vertical scaling</span> buys you more space to store more indexes ... but that&#x27;s like fixing traffic congestion by adding another lane to the freeway.</p><p><span class="bg-blue-100/80 text-blue-700 dark:bg-blue-800/80 dark:text-blue-300">Sharding</span> creates more, smaller databases, so having more indexes is less of a problem. You can afford to create many more indexes than if your large table was on a single cluster since a write only updates indexes on the shard that owns that row. Sharding is the <em>good option</em> for balancing a lot of data and many indexes.</p><h2 id="wide-tables-split-across-pages-and-files"><a href="https://planetscale.com/blog/dealing-with-large-tables-in-postgres#wide-tables-split-across-pages-and-files">Wide tables split across pages and files</a></h2><p>A table is not only large because it has many rows; it might be that the rows are wide with many columns, or each row contains a large amount of data.</p><iframe src="https://planetscale.com/blog/dealing-with-large-tables-in-postgres/iframe#wide" title="Interactive: a wide row fills most of a page so the next row has to take a new one" loading="lazy"></iframe><p>If a row exceeds ~2KB, oversized values go to TOAST, a separate table and indexes next to the heap you are already struggling to vacuum.</p><p>Each toasted value gets a 32-bit OID, about 4 billion per table. Updates of toasted values take a new OID. High-churn wide tables fill that space, and inserts slow down as Postgres hunts for a free one before the hard stop.</p><p>Whatever is left still has to fit into a single 8KB page, as Postgres will not split a row across pages. If a tuple cannot fit in the free space on any existing page, it gets a new page.</p><p>For a read-heavy table, you want pages packed tight (a high fillfactor), so scans walk as few pages as possible. For an update-heavy table, you want the opposite. Lower the fillfactor so an update can often stay on the same page instead of allocating a new one.</p><p>On a small table, the wrong fillfactor is a few wasted pages. On a large, wide table it could be terabytes of sparse pages, or a constant stream of new ones that vacuum, WAL, and backups all have to follow.</p><p>A large table is a heap, plus indexes, plus TOAST, and some operations still walk those files one at a time. <code>pg_database_size()</code> is one example. It stats every file in the database serially. On a large, wide table, that can pin a core.</p><p><span class="bg-orange-100/80 text-orange-700 dark:bg-orange-800/70 dark:text-orange-200">Partitioning</span> is a genuinely good solution for this class of large-table problems. Fillfactor can differ per-partition. Each partition gets its own TOAST table, so OID space is per slice.</p><p>However, with more files in one cluster, <code>pg_database_size()</code> can get worse.</p><p><span class="bg-yellow-100/70 text-yellow-700 dark:bg-yellow-800 dark:text-yellow-300">Vertical scaling</span> can hide a bad fillfactor for a while with extra disk space. Faster disks make TOAST vacuum and file <code>stat()</code>s cheaper. But you cannot buy greater limits than 8KB pages, the 2KB TOAST threshold, or the 4 billion OIDs.</p><p><span class="bg-blue-100/80 text-blue-700 dark:bg-blue-800/80 dark:text-blue-300">Sharding</span> creates individual Postgres instances, so TOAST OID space resets per cluster. A bad fillfactor hurts less because the heap is smaller. File walks are per shard.</p><p>Sharding does not, by itself, let hot and cold rows use different fillfactors. Partitioning still wins there.</p><h2 id="sharding-is-the-solution-to-large-tables"><a href="https://planetscale.com/blog/dealing-with-large-tables-in-postgres#sharding-is-the-solution-to-large-tables">Sharding is the solution to large tables</a></h2><p>Just as partitioning breaks up a single table into many small pieces, sharding distributes the workload of your reads and writes across many database clusters.</p><p>Let&#x27;s revisit the cascade delete story.</p><p>When replicas lagged, every read went to the primary. On a sharded database, each shard is its own cluster, with its own WAL and replicas. If the affected rows of A and B lived on one shard, that shard could still lag, and its reads pile onto its primary, but that could not fail the LSN check for the rest of the product. If those 100,000 deletes were spread across shards, the WAL burst would be split. No replica stream would have to replay the whole thing.</p><p>Your single-cluster large table likely processes a high throughput of traffic. Vertical scaling can help, but sharding does it better. With more clusters receiving and processing writes, a single table doesn&#x27;t strain the entire cluster.</p><p>Additionally, cluster limits that cannot be solved by partitioning or vertical scaling are resolved. Postgres&#x27; hard-coded ceilings of 32-bit XIDs, TOAST OID and more become per-shard limits instead.</p><p>Sharded database backups are individually smaller and can be <a href="https://planetscale.com/blog/massively-parallel-postgres-backups">massively parallelized</a>, making database restoration faster as well. Operations finish at the time of the slowest shard, not all at once waiting on large, bloated tables.</p><p>Cache eviction is a problem with large tables and their working sets. While more resources won&#x27;t fit a large table into RAM, you often can per shard. Shard-local queries become shorter and faster.</p><p>Neki, sharded Postgres, lets your application write queries as if it were a single database, while splitting a large table into smaller, automatically distributed parts.</p><p>It contains the logic for where to send reads and writes. You still have to determine how that data is spread. That fan-out is covered in our post on <a href="https://planetscale.com/blog/what-is-a-data-topology">data topologies</a>.</p><p>Sharding shares the large table load across multiple clusters. If that&#x27;s a problem you need solved, request access to <a href="https://neki.dev/">Neki</a>.</p><div class="mb-3 border p-3 border-blue-600 dark:border-blue-500"><p><span class="bg-blue-600 px-sm text-white dark:bg-blue-500 dark:text-black">Note</span></p><p>If you&#x27;re interested, we also have an article covering <a href="https://planetscale.com/blog/dealing-with-large-tables">big tables with MySQL and Vitess</a>.</p></div>]]></content>
    <summary><![CDATA[Postgres presents pretty predictable performance problems when dealing with large tables. Sharding solves this.]]></summary>
  </entry>
  <entry>
    <title>The history of Postgres sharding</title>
    <link href="https://planetscale.com/blog/the-history-of-postgres-sharding"/>
    <id>https://planetscale.com/blog/the-history-of-postgres-sharding</id>
    <published>2026-08-24T00:00:00.000Z</published>
    <updated>2026-08-24T00:00:00.000Z</updated>
    <author>
      <name>Josh Brown</name>
    </author>
    <category term="engineering"/>
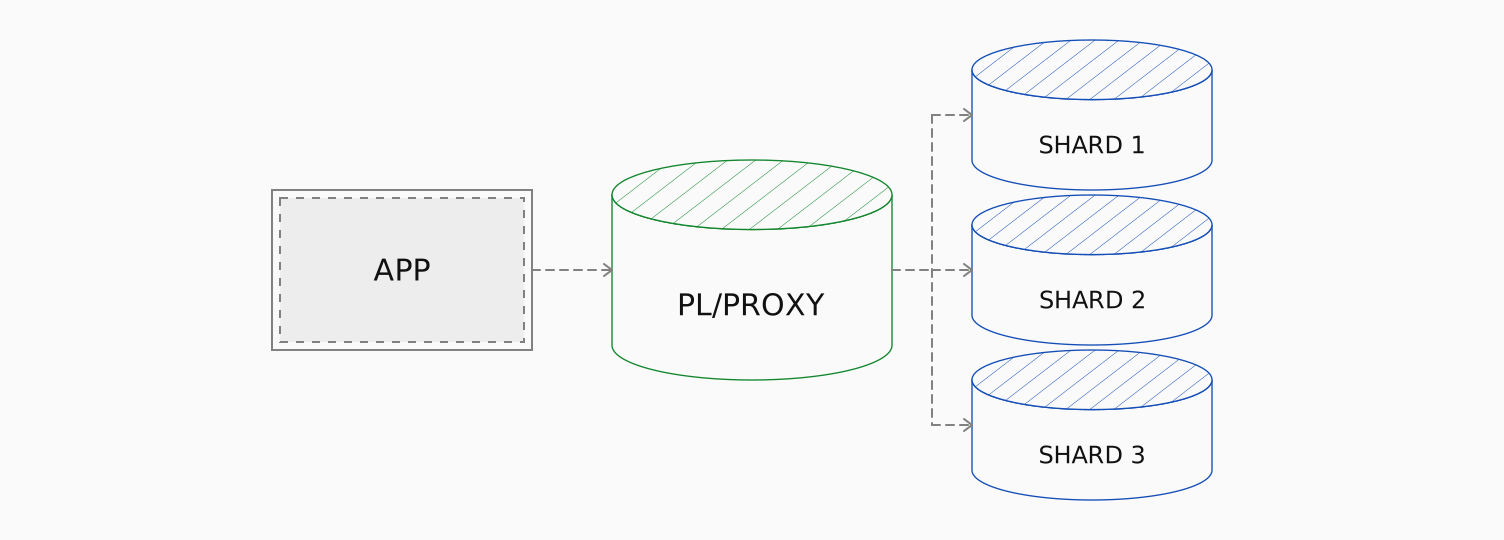
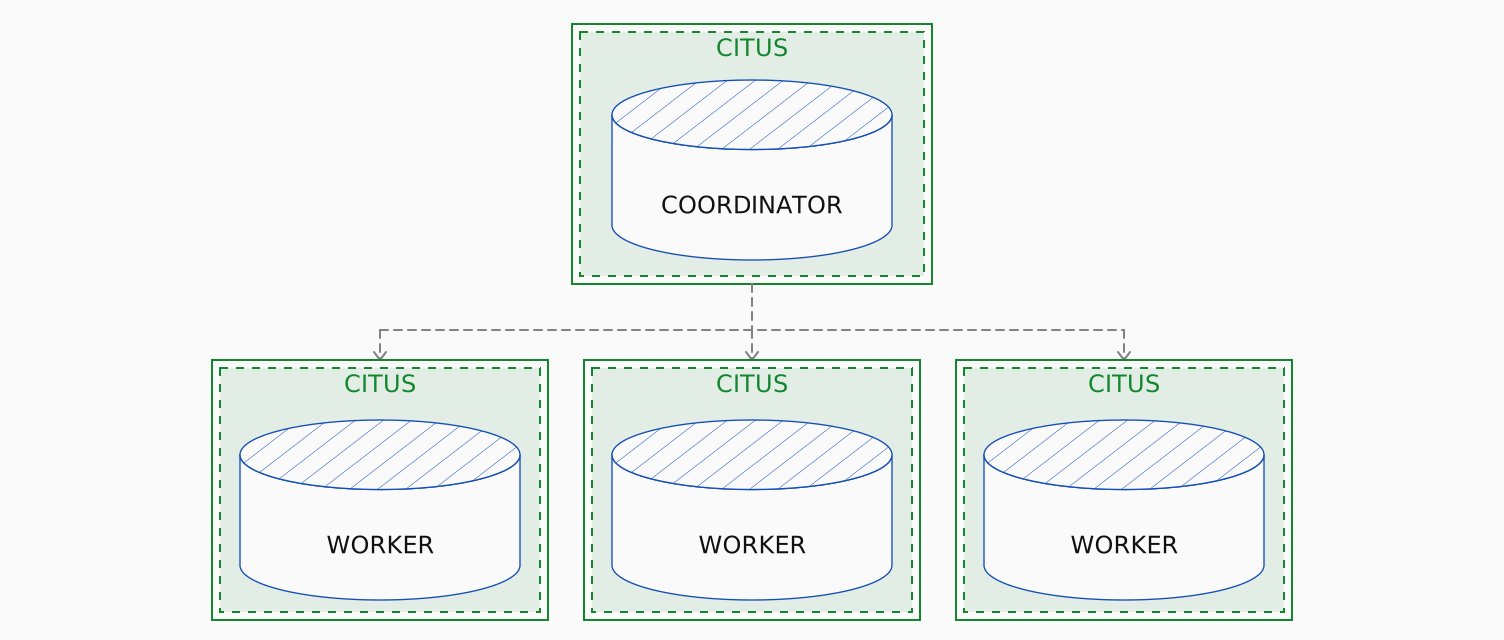
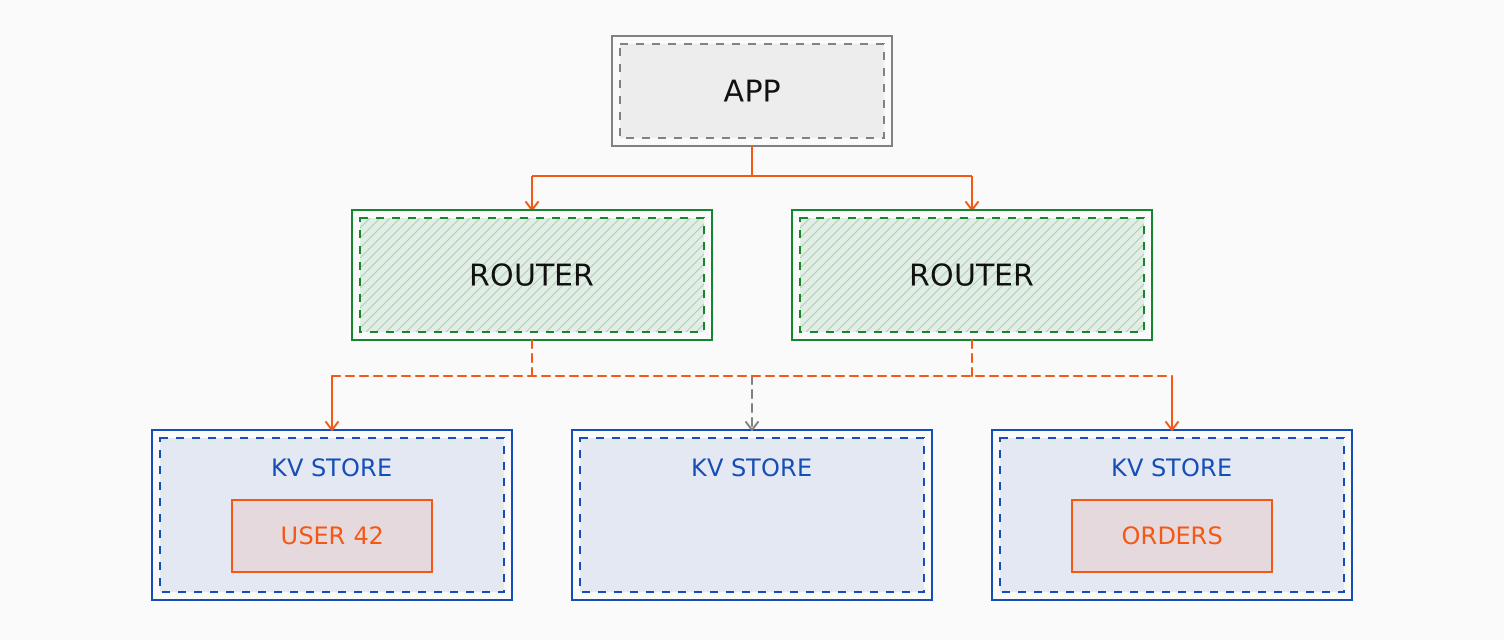
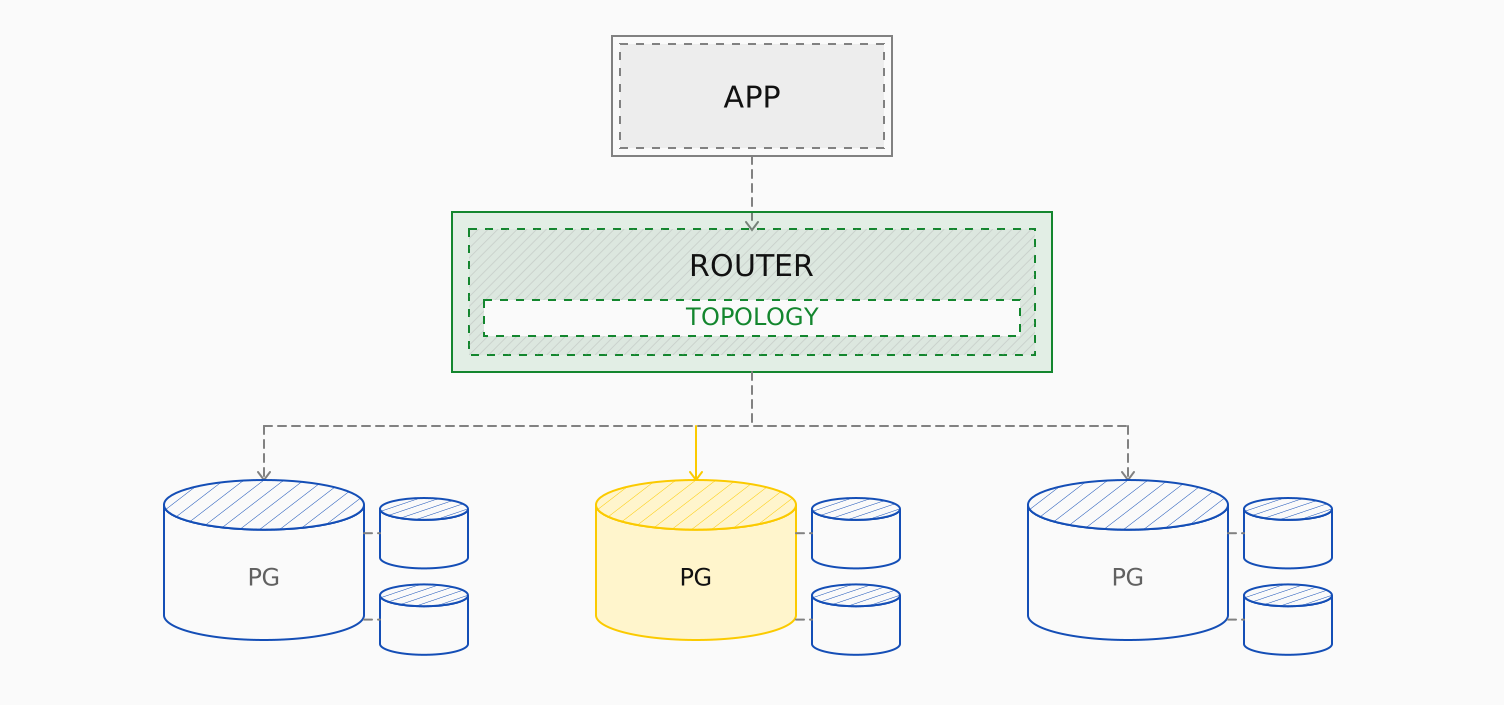
    <content type="html"><![CDATA[<p>Over the past 20 years, many companies have achieved such a scale that their database could no longer support the workload assigned to it. The solution is almost universally to shard the database, but only when absolutely necessary due to the added complexity.</p><p>MySQL was a much more popular choice for relational databases in the 2010s and because of this, the tooling around things like online schema changes and sharding progressed much quicker. Tools like <a href="https://github.com/github/gh-ost">gh-ost</a>, <a href="https://planetscale.com/vitess">Vitess</a>, and more were built around this ecosystem.</p><p>Postgres, on the other hand, had one-offs, then Citus, then proxy-like solutions. Now, in 2026, <a href="https://planetscale.com/neki">Neki</a> builds on the lessons learned from the incredible engineers that have built not only Vitess, but all the other sharding solutions that came before it.</p><p>To fully understand Neki, and why we built it, it&#x27;s important to have an understanding of how we got here.</p><p><picture class="block"><source media="(prefers-color-scheme: light), (prefers-color-scheme: no-preference)" srcSet="https://planetscale-images.imgix.net/assets/timeline-DFUq1emi.svg?auto=compress%2Cformat"><source media="(prefers-color-scheme: dark)" srcSet="https://planetscale-images.imgix.net/assets/timeline-darkmode-BB-2zWJs.svg?auto=compress%2Cformat"><img alt="A twenty-year timeline from Ultima Online shards through Skype, Vitess, Instagram, Citus, and Neki." src="https://planetscale-images.imgix.net/assets/timeline-DFUq1emi.svg?auto=compress%2Cformat" width="1504" height="300" loading="lazy"></picture></p><h2 id="it-started-in-a-video-game"><a href="https://planetscale.com/blog/the-history-of-postgres-sharding#it-started-in-a-video-game">It started in a video game</a></h2><p><picture class="block"><source media="(prefers-color-scheme: light), (prefers-color-scheme: no-preference)" srcSet="https://planetscale-images.imgix.net/assets/uo-Co9VDuNu.png?auto=compress%2Cformat"><img alt="An Ultima Online world copied onto independent parallel shards." src="https://planetscale-images.imgix.net/assets/uo-Co9VDuNu.png?auto=compress%2Cformat" width="1280" height="878" loading="lazy"></picture></p><p>One of the more prominent theories is that the term &quot;Shard&quot; originated, of all places, from a video game. Ultima Online is an <a href="https://en.wikipedia.org/wiki/Massively_multiplayer_online_role-playing_game">MMORPG</a> created in 1997. The developers quickly realized they needed to host players on multiple servers to sustain growth.</p><p>To support this, they invented lore that would make the idea of multiple servers make sense in the fictional universe. <a href="https://www.raphkoster.com/2009/01/08/database-sharding-came-from-uo/">After digging through heaps of lore</a>, &quot;Shards&quot; seemed like the best fit.</p><p>At the end of Ultima I, an evil wizard is defeated who had tried to trap the world into a crystal. When the wizard is defeated, his crystal breaks into &quot;shards&quot;, each holding a copy of the world within it.</p><p>And thus, the term &quot;sharding&quot; was used to denote parallel, independently evolving servers. This term slowly made its way through the industry, narrowing its meaning to database sharding in particular.</p><h2 id="why-mysql-got-there-first"><a href="https://planetscale.com/blog/the-history-of-postgres-sharding#why-mysql-got-there-first">Why MySQL got there first</a></h2><p>The LAMP stack was all the rage in the early 2010s. This gave the sharding story for MySQL a head start, as most of the successful companies had started in an era where MySQL was the popular choice.</p><p>Facebook was one of the first companies to truly hit a global scale, serving over 100m active users in 2008 on roughly 1,800 MySQL nodes. Initially, sharding was done at the application level. Each user was assigned an ID that could be used to determine which shard their data lives on.</p><p>Eventually, as Facebook grew, their need for a specialized layer on top of MySQL became apparent. Facebook created <a href="https://engineering.fb.com/2013/06/25/core-infra/tao-the-power-of-the-graph/">TAO</a> to accommodate the scale and access patterns that fit their needs.</p><p>YouTube, similarly, started as a single primary node. When the load grew too high, they added replicas. When the primary could no longer handle write pressure, they began the monumental task of sharding.</p><p>Originally, their solution was also baked into the application layer itself. YouTube&#x27;s backend would determine which database server a user request should go to. Around 2010, they pulled out the routing layer into a standalone project, and thus <a href="https://vitess.io/docs/23.0/overview/history/">Vitess was born</a>.</p><p>Many companies that began scaling their LAMP-based stacks slowly consolidated on Vitess as their sharding solution.</p><p>It took Postgres much longer to get a similar solution. Many companies that would later hit Postgres scaling limits built in-house solutions. Most of these were never separated into standalone software, often due to how fine tuned they were for each company&#x27;s needs.</p><h2 id="build-it-yourself-then-live-in-it"><a href="https://planetscale.com/blog/the-history-of-postgres-sharding#build-it-yourself-then-live-in-it">Build it yourself, then live in it</a></h2><p>Early Postgres sharding was frequently built as custom, in-house solutions. If a single Postgres node couldn&#x27;t handle your scale, start spinning up more nodes, create a router, and a team of engineers to manage it.</p><p>For companies successful enough to need sharding, dedicating a team to solving database scaling was not an impossible ask. If the database can&#x27;t scale up, the application will start failing, and growth stops.</p><h3 id="skype-and-plproxy"><a href="https://planetscale.com/blog/the-history-of-postgres-sharding#skype-and-plproxy">Skype and PL/Proxy</a></h3><p>In 2007 <a href="https://plproxy.github.io/">Skype announced PL/Proxy</a> to the Postgres mailing list. The announced version was Skype&#x27;s second iteration (v2) of PL/Proxy that ran as an extension on a Postgres Proxy database.</p><p><picture class="block"><source media="(prefers-color-scheme: light), (prefers-color-scheme: no-preference)" srcSet="https://planetscale-images.imgix.net/assets/pl-proxy-DHPI1ZZe.svg?auto=compress%2Cformat"><source media="(prefers-color-scheme: dark)" srcSet="https://planetscale-images.imgix.net/assets/pl-proxy-darkmode-DHtmfdrB.svg?auto=compress%2Cformat"><img alt="PL/Proxy architecture: one central routing database sending queries to downstream shards." src="https://planetscale-images.imgix.net/assets/pl-proxy-DHPI1ZZe.svg?auto=compress%2Cformat" width="1504" height="540" loading="lazy"></picture></p><p>PL/Proxy was one of the earliest sharding solutions, allowing operators to route queries to different shards by defining SQL functions in the proxy database. The downside to this approach was that every operation that would result in a sharded query would need a defined function to route to the proper shard, defined by the user.</p><p>For instance, if you wanted to shard a <code>users</code> table, you would need to create PL/Proxy functions to insert, update, and read. For each new query pattern, you would need to create a new function and call it from the application layer.</p><p>Although this drastically improved scalability by removing the need for the application to keep track of each downstream shard, the application and database operators would need to work in tandem to ensure every query pattern is defined in the proxy and routed correctly.</p><h3 id="instagram-and-logical-shards"><a href="https://planetscale.com/blog/the-history-of-postgres-sharding#instagram-and-logical-shards">Instagram and logical shards</a></h3><p>Instagram is another early pioneer of Postgres sharding. In 2012, Instagram&#x27;s ~30 million users could no longer fit onto a single EC2 instance running Postgres.</p><p>The solution for Instagram was to do logical sharding at the application layer. The application would map thousands of logical schemas down to a few physical shards. Any given physical database could have multiple logical schemas (collections of tables) within it.</p><p>When a given schema grew too large, it could be migrated to a new physical database, and the application would re-map that logical schema to the new database address. This was an elegant solution for their use case, since it required low overhead to manage. This system helped Instagram scale for years.</p><p>Instagram had debated going with PL/Proxy, but decided to hand-roll their own solution to keep with a more minimalistic design, specifically not needing to deal with the SQL function overhead, and for reduced network latency. Their application would talk directly to each shard without a proxy.</p><p>The downside to this approach, however, is that cross shard queries must be managed in the application layer, and moving data between databases requires careful coordination between the app&#x27;s mapping of schemas and physical shards. Sharding was also <a href="https://medium.com/instagram-engineering/sharding-ids-at-instagram-1cf5a71e5a5c">limited to their custom integer ID approach</a>, so every table that needed sharding would also need an ID column.</p><h2 id="then-someone-put-it-in-postgres"><a href="https://planetscale.com/blog/the-history-of-postgres-sharding#then-someone-put-it-in-postgres">Then someone put it in Postgres</a></h2><p>Citus was the first open-source sharding solution for Postgres that was designed for wider adoption. Designed originally in 2011, Citus started as a fork of Postgres.</p><p>Later on in 2016, Citus was refactored into a pure extension of Postgres, rather than a fork. Citus shards data by defining nodes as either coordinators or workers.</p><p>Every node is a standalone Postgres instance running the Citus extension. The coordinator node holds the routing map, routes queries as needed, and keeps track of all downstream worker nodes. Worker nodes store the sharded data, and execute the queries passed on to them from the coordinator.</p><p>Citus improves on earlier Postgres sharding solutions by keeping the sharding metadata and routing logic within one central node. This adds some undesirable side effects, however. First, the coordinator becomes the bottleneck. Although some queries in Citus 11+ can go through worker nodes, your application either needs to send all requests to the coordinator node, or keep track of multiple connection strings to each worker it wants to distribute load onto.</p><p>Another downside is that shard management and backups are a semi-manual process. Adding a shard with more resources for a noisy tenant, or many small shards for a wide shard space requires substantial manual configuration of not only the database servers themselves, but wiring them up together with Citus. Managing backups is also external to Citus, so operators still need to build the proper infrastructure to accommodate disaster recovery and healing nodes as needed.</p><p><picture class="block"><source media="(prefers-color-scheme: light), (prefers-color-scheme: no-preference)" srcSet="https://planetscale-images.imgix.net/assets/citus-CBpzQboB.svg?auto=compress%2Cformat"><source media="(prefers-color-scheme: dark)" srcSet="https://planetscale-images.imgix.net/assets/citus-darkmode-CPP1ktHJ.svg?auto=compress%2Cformat"><img alt="A Citus cluster with a Citus extension wrapping Postgres on a coordinator and worker nodes." src="https://planetscale-images.imgix.net/assets/citus-CBpzQboB.svg?auto=compress%2Cformat" width="1504" height="640" loading="lazy"></picture></p><p>Other similar attempts have been made to bring sharding to Postgres such as PgDog and Aurora Limitless. PgDog is a spiritual successor to PgCat, both of which improve on Citus&#x27;s architecture substantially.</p><p>PgDog operates as a pure proxy layer in front of Postgres clusters. Although PgDog supports sharding, managing schema changes and resharding operations is still a very involved and manual task. Managing backups and disaster recovery of the Postgres nodes is also up to the operator.</p><p>Aurora operates in a similar fashion. Routers front Postgres nodes backed by EBS, with support for sharding.</p><h2 id="hide-the-shard-key"><a href="https://planetscale.com/blog/the-history-of-postgres-sharding#hide-the-shard-key">Hide the shard key</a></h2><p>Other solutions to scaling Postgres resulted in not using real Postgres at all, opting for a Postgres-compatible approach. Google published the <a href="https://cloud.google.com/spanner">Spanner</a> research paper in 2012 while using it internally, later releasing it as a public service in 2017.</p><p>Spanner&#x27;s approach hides sharding from the user and operator altogether, opting for automatic distribution of data across nodes. Instead of defining shard keys or indexes, Spanner splits and moves tables automatically as table size grows.</p><p>This is done by storing the data as key-value pairs. These key-value pairs are grouped into &quot;splits&quot; and replicated across the storage layer, using the <a href="https://en.wikipedia.org/wiki/Paxos_(computer_science)">Paxos</a> consensus algorithm to maintain consistency.</p><p><a href="https://www.cockroachlabs.com/">CockroachDB</a> and <a href="https://www.yugabyte.com/">Yugabyte</a> are similar distributed Postgres-compatible database solutions. Note that they are Postgres-compatible, not actual Postgres solutions. Inevitably this results in lower fine-tune control over the cluster compared to the large amount of settings and flags available for actual Postgres clusters.</p><div class="mb-3 border p-3 border-blue-600 dark:border-blue-500"><p><span class="bg-blue-600 px-sm text-white dark:bg-blue-500 dark:text-black">Note</span></p><p>Yugabyte and CockroachDB are open source projects. However, Spanner is closed source.</p></div><p>All of these solutions share the same pitfalls. Performance can be disjoint from expected results since the underlying data access layer is not truly Postgres.</p><p>Extension support also becomes limited, along with some Postgres native SQL features and settings.</p><p>Data placement also becomes hard to predict. Related rows can easily drift across multiple storage locations causing drastically increased latency.</p><p>Explicit sharding makes it easy for engineers to understand and plan around cross-shard latency penalties. Automatic sharding blurs these lines, making it impossible to determine when or how a table will shard, and how drastically performance will drop because of it.</p><p><picture class="block"><source media="(prefers-color-scheme: light), (prefers-color-scheme: no-preference)" srcSet="https://planetscale-images.imgix.net/assets/distributed-sql-CEYpq2Bq.svg?auto=compress%2Cformat"><source media="(prefers-color-scheme: dark)" srcSet="https://planetscale-images.imgix.net/assets/distributed-sql-darkmode-DMouKgnD.svg?auto=compress%2Cformat"><img alt="An application request fans out through multiple routers to KV store buckets, with related rows landing on different buckets." src="https://planetscale-images.imgix.net/assets/distributed-sql-CEYpq2Bq.svg?auto=compress%2Cformat" width="1504" height="640" loading="lazy"></picture></p><h2 id="building-the-best-solution"><a href="https://planetscale.com/blog/the-history-of-postgres-sharding#building-the-best-solution">Building the best solution</a></h2><p>The amount of engineering work that went into many of these systems cannot be overstated. As we have seen however, that does not make them perfect. Neki builds on the lessons and foundations from all of its predecessors.</p><p>Neki&#x27;s goal is to raise the bar for scaling Postgres.</p><p>While Spanner and CockroachDB shard data automatically, Neki requires explicit sharding. Developers have complete control over exactly how data is distributed across clusters.</p><p>Neki also uses true Postgres clusters under the hood. This means support for Postgres extensions, stronger SQL compatibility, and predictable performance.</p><p>Compared to PL/Proxy or Citus, sharding is defined by a routing file called the <a href="https://planetscale.com/blog/what-is-a-data-topology">data topology</a>, allowing database operators to define and evolve sharding schemes over time. Since each Neki router only holds a cache of the topology, routers can be horizontally scaled with ease.</p><p>One connection string can go to any router, letting your application treat 1,000 shards as <a href="https://planetscale.com/blog/making-768-servers-look-like-1">one unified database</a>. No single router becomes the bottleneck.</p><p>Each Neki shard has its own primary and replicas. If a primary dies, Neki can bring the cluster back to a healthy state. Routers sit in front, connecting all the shards together.</p><p><picture class="block"><source media="(prefers-color-scheme: light), (prefers-color-scheme: no-preference)" srcSet="https://planetscale-images.imgix.net/assets/neki-DWGXUOKW.svg?auto=compress%2Cformat"><source media="(prefers-color-scheme: dark)" srcSet="https://planetscale-images.imgix.net/assets/neki-darkmode-B9hhiQed.svg?auto=compress%2Cformat"><img alt="An application connects to a Neki router that uses an explicit data topology to send queries to the correct Postgres shards." src="https://planetscale-images.imgix.net/assets/neki-DWGXUOKW.svg?auto=compress%2Cformat" width="1504" height="705" loading="lazy"></picture></p><p>Neki also allows each group of shards to be independently sizeable and scalable, making it possible to precisely control resources for every part of your cluster.</p><p>Unlike PgDog or Citus, Neki handles backups, restores, node health, <a href="https://planetscale.com/docs/postgres/monitoring/query-insights">Insights</a>, connection pooling, schema changes, and much more. By being more than just an extension or pure proxy, Neki can manage every part of the database life cycle.</p><p>Sharding used to be one of the scariest things a growing team could face. Neki aims to change that, making it easier than ever for teams to reach truly planet-scale with as little friction as possible, the familiarity of real Postgres, and incredible performance. Sign up today for early access at <a href="https://neki.dev/">neki.dev</a>.</p>]]></content>
    <summary><![CDATA[Why has it taken so long to get good Postgres sharding? The last 20 years are the answer.]]></summary>
  </entry>
  <entry>
    <title>What is a data topology?</title>
    <link href="https://planetscale.com/blog/what-is-a-data-topology"/>
    <id>https://planetscale.com/blog/what-is-a-data-topology</id>
    <published>2026-08-17T00:00:00.000Z</published>
    <updated>2026-08-17T00:00:00.000Z</updated>
    <author>
      <name>Harshit Gangal</name>
    </author>
    <author>
      <name>Ahmed Darwich</name>
    </author>
    <category term="engineering"/>
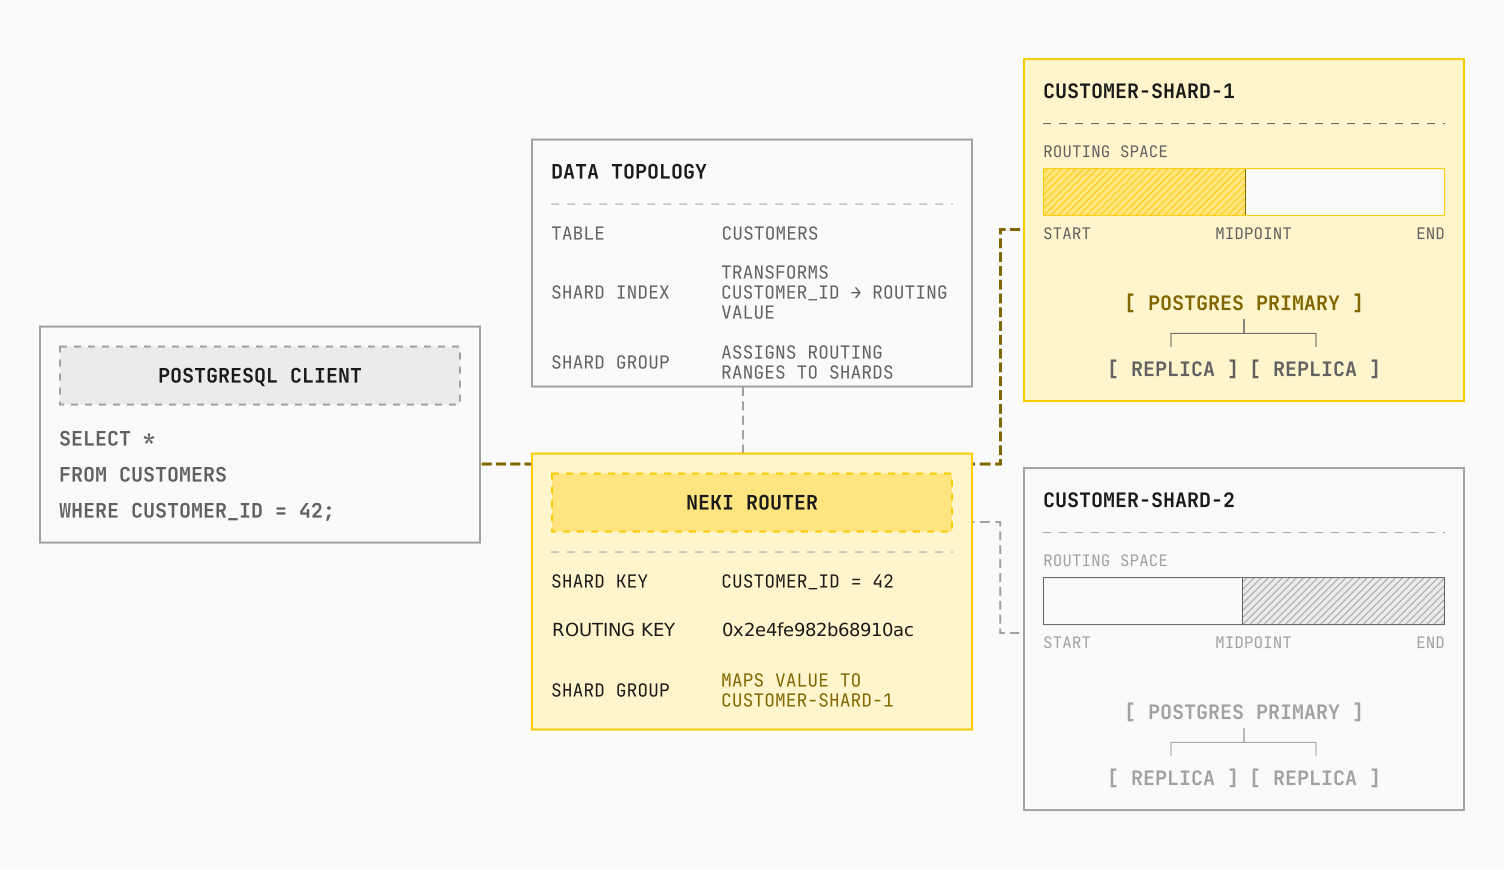
    <content type="html"><![CDATA[<p>“Vitess for PostgreSQL” is a useful shorthand for the ambition behind Neki, but it significantly understates the architecture we have built. Neki carries forward what we learned from Vitess in a new sharding architecture designed around PostgreSQL’s internals and semantics from the start.</p><p>PlanetScale has spent years building and operating Vitess at scale. That experience has shaped how we approach query routing, data placement, and the challenge of making many database servers behave like one.</p><p>We have previously written about <a href="https://planetscale.com/blog/making-768-servers-look-like-1">how Neki makes hundreds of database servers behave like one</a>. Here, we take a closer look at the mechanism that controls where data lives and how queries are routed.</p><p>One of Neki’s core design goals is flexibility in data placement. There are many ways engineers need to map their logical database schemas onto physical shards in order to optimize for performance and scalability.</p><p>That configuration is expressed as a <strong>data topology</strong>.</p><h2 id="what-is-a-data-topology"><a href="https://planetscale.com/blog/what-is-a-data-topology#what-is-a-data-topology">What is a data topology?</a></h2><p><a href="https://planetscale.com/blog/what-is-database-sharding-and-how-does-it-work">Sharding</a> spreads data across multiple servers, but it also creates a unique routing problem. How does each query find the shard or shards that hold the data it needs?</p><p>Without a routing layer, the application would need to keep track of where its data lives and choose the correct shard for each query.</p><p>A data topology is how Neki answers that question. It is a JSON configuration that describes a PostgreSQL sharding scheme by mapping logical PostgreSQL tables to groups of physical shards and giving routers the information they need to route queries.</p><p><picture class="block"><source media="(prefers-color-scheme: light), (prefers-color-scheme: no-preference)" srcSet="https://planetscale-images.imgix.net/assets/neki-router-data-topology-shards-BJvkLSGa.svg?auto=compress%2Cformat"><source media="(prefers-color-scheme: dark)" srcSet="https://planetscale-images.imgix.net/assets/neki-router-data-topology-shards-darkmode-DzeXwqJn.svg?auto=compress%2Cformat"><img alt="A customer query enters a Neki router, which uses its cached data topology to select a PostgreSQL shard containing a primary and replicas." src="https://planetscale-images.imgix.net/assets/neki-router-data-topology-shards-BJvkLSGa.svg?auto=compress%2Cformat" width="1504" height="870" loading="lazy"></picture></p><p>A data topology has three building blocks:</p><ul><li><strong>Shard indexes</strong> specify the column or expression Neki uses to route a row and how its value is transformed for routing. The selected column or expression is called the <em>shard key</em>, and its transformed value is the <em>routing key</em> that Neki uses to select a shard.</li><li><strong>Shard groups</strong> define a set of physical shards and assign a range of routing keys to each one. They also specify the default shard index for tables in the group. Related tables that use the same shard key can be colocated, allowing joins and transactions between them to stay local.</li><li><strong>Databases</strong> bind tables to shard groups, following the PostgreSQL hierarchy of databases, schemas, and tables. A table can name its shard group directly or inherit a default from its schema, its database, or the cluster.</li></ul><p>Together, these building blocks tell Neki how to route queries.</p><p>The data topology does not provision or manage physical shards. Those shards are provisioned separately, and the topology refers to each one by a stable ID. In Neki, a shard consists of a PostgreSQL primary and its replicas.</p><h2 id="example-of-a-data-topology"><a href="https://planetscale.com/blog/what-is-a-data-topology#example-of-a-data-topology">Example of a data topology</a></h2><p>Consider a <code>store</code> database that partitions related data around its customers.</p><div class="code-block" data-language="sql"><div class="min-w-0 max-w-full"><pre class="shiki shiki-themes planetscale-light planetscale-dark" style="--shiki-light:#2b2b2b;--shiki-dark:#e1e1e1;--shiki-light-bg:#ebebeb;--shiki-dark-bg:#1a1a1a" tabindex="0"><code><span class="line"><span style="--shiki-light:#F35815;--shiki-dark:#F35815">CREATE</span><span style="--shiki-light:#F35815;--shiki-dark:#F35815"> TABLE</span><span style="--shiki-light:#5E49AF;--shiki-dark:#B7A5FB"> customers</span><span style="--shiki-light:#2B2B2B;--shiki-dark:#E1E1E1"> (</span></span>
<span class="line"><span style="--shiki-light:#2B2B2B;--shiki-dark:#E1E1E1">  customer_id </span><span style="--shiki-light:#F35815;--shiki-dark:#F35815">bigint</span><span style="--shiki-light:#F35815;--shiki-dark:#F35815"> PRIMARY KEY</span><span style="--shiki-light:#2B2B2B;--shiki-dark:#E1E1E1">,</span></span>
<span class="line"><span style="--shiki-light:#F35815;--shiki-dark:#F35815">  name</span><span style="--shiki-light:#F35815;--shiki-dark:#F35815"> text</span><span style="--shiki-light:#F35815;--shiki-dark:#F35815"> NOT NULL</span><span style="--shiki-light:#2B2B2B;--shiki-dark:#E1E1E1">,</span></span>
<span class="line"><span style="--shiki-light:#F35815;--shiki-dark:#F35815">  address</span><span style="--shiki-light:#F35815;--shiki-dark:#F35815"> text</span><span style="--shiki-light:#F35815;--shiki-dark:#F35815"> NOT NULL</span></span>
<span class="line"><span style="--shiki-light:#2B2B2B;--shiki-dark:#E1E1E1">);</span></span>
<span class="line"></span></code></pre></div></div><p>Suppose the <code>customers</code> table needs to be distributed across two shards. Here&#x27;s how a data topology might look:</p><p><picture class="block"><source media="(prefers-color-scheme: light), (prefers-color-scheme: no-preference)" srcSet="https://planetscale-images.imgix.net/assets/data-topology-json-CCh5Wtoi.svg?auto=compress%2Cformat"><source media="(prefers-color-scheme: dark)" srcSet="https://planetscale-images.imgix.net/assets/data-topology-json-darkmode-CSBdTDxQ.svg?auto=compress%2Cformat"><img alt="An example Neki data topology annotated with its shard index, shard group, and database mapping." src="https://planetscale-images.imgix.net/assets/data-topology-json-CCh5Wtoi.svg?auto=compress%2Cformat" width="1504" height="1477" loading="lazy"></picture></p><h3 id="shard-indexes"><a href="https://planetscale.com/blog/what-is-a-data-topology#shard-indexes">Shard indexes</a></h3><p>The topology names this shard index <code>customer_id_xxhash</code>. It tells Neki to convert each <code>customer_id</code> into a routing key using <code>xxhash</code>.</p><p>Neki supports three shard-index strategies:</p><ul><li><strong>Hash-based</strong> indexes use a hash function to map a value into the routing space. Neki currently uses <code>xxhash</code>.</li><li><strong>Modulo-based</strong> indexes divide an integer by a configured modulus and use the remainder.</li><li><strong>Range-based</strong> indexes use an integer value directly, without hashing it.</li></ul><p>Each strategy takes a different path from <code>customer_id</code> to a physical shard:</p><p><picture class="block"><source media="(prefers-color-scheme: light), (prefers-color-scheme: no-preference)" srcSet="https://planetscale-images.imgix.net/assets/shard-index-routing-Bde5tmWH.svg?auto=compress%2Cformat"><source media="(prefers-color-scheme: dark)" srcSet="https://planetscale-images.imgix.net/assets/shard-index-routing-darkmode-Dt8K1rWM.svg?auto=compress%2Cformat"><img alt="Three Neki shard-index strategies showing how hash-based routing with xxhash, modulo-based routing, and range-based routing map customer IDs to shards." src="https://planetscale-images.imgix.net/assets/shard-index-routing-Bde5tmWH.svg?auto=compress%2Cformat" width="1504" height="958" loading="lazy"></picture></p><p>In this example, <code>customer_id</code> is the shard key, and its value is <code>42</code>. Each strategy transforms its value into a different routing key. <code>xxhash</code> produces <code>0x2e4fe982b68910ac</code>, which falls in the range assigned to <code>customer-shard-1</code>. <code>modulo</code> calculates <code>42 mod 4</code>, producing <code>2</code>, which falls in the range assigned to <code>customer-shard-2</code>. <code>range</code> uses <code>42</code> directly, which falls in the range assigned to <code>customer-shard-1</code>. In each case, the shard group selects the physical shard whose range contains the routing key.</p><h3 id="shard-groups"><a href="https://planetscale.com/blog/what-is-a-data-topology#shard-groups">Shard groups</a></h3><p>The <code>customer_data</code> shard group divides the possible <code>xxhash</code> results between two shards. This example focuses on hash-based routing, but shard groups work similarly with modulo-based and range-based strategies. Key-range boundaries are written as hexadecimal prefixes, so <code>80</code> expands to <code>0x8000000000000000</code>, the midpoint of the routing space:</p><div class="code-block" data-language="text"><div class="min-w-0 max-w-full"><pre class="shiki shiki-themes planetscale-light planetscale-dark" style="--shiki-light:#2b2b2b;--shiki-dark:#e1e1e1;--shiki-light-bg:#ebebeb;--shiki-dark-bg:#1a1a1a" tabindex="0"><code><span class="line"><span>customer-shard-1: 0x0000000000000000 through 0x7fffffffffffffff</span></span>
<span class="line"><span>customer-shard-2: 0x8000000000000000 through 0xffffffffffffffff</span></span>
<span class="line"><span></span></span></code></pre></div></div><p>For example, these two customer IDs land on different shards because their hashes fall in different ranges.</p><div class="code-block" data-language="text"><div class="min-w-0 max-w-full"><pre class="shiki shiki-themes planetscale-light planetscale-dark" style="--shiki-light:#2b2b2b;--shiki-dark:#e1e1e1;--shiki-light-bg:#ebebeb;--shiki-dark-bg:#1a1a1a" tabindex="0"><code><span class="line"><span>customer_id 42 → 0x2e4fe982b68910ac → customer-shard-1</span></span>
<span class="line"><span>customer_id 1  → 0xf36b4a1a44f78bf3 → customer-shard-2</span></span>
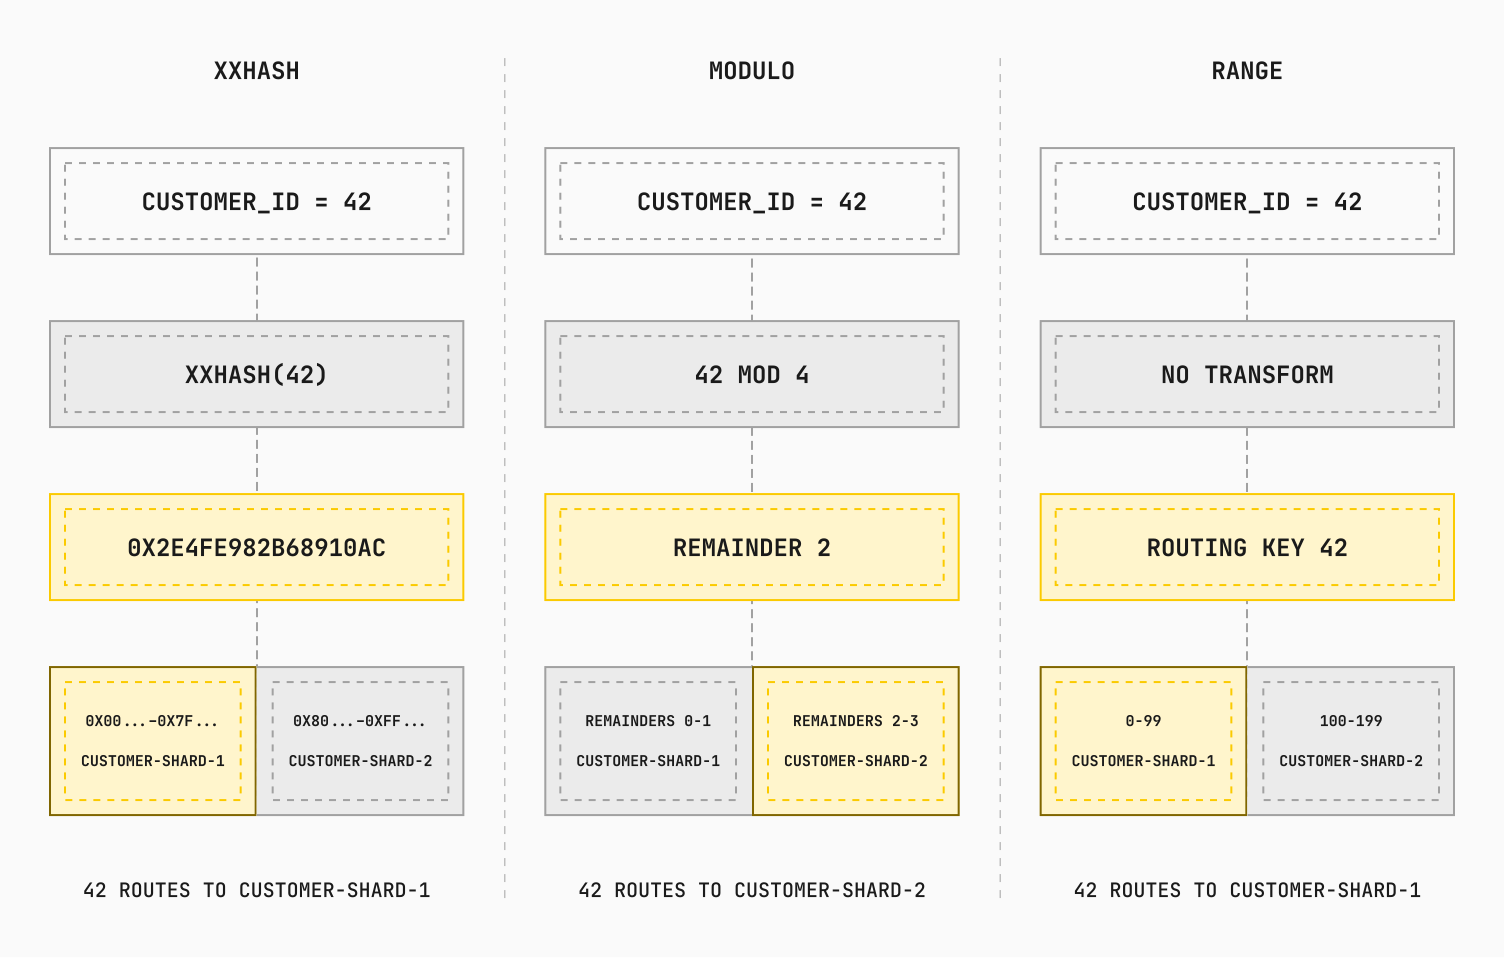
<span class="line"><span></span></span></code></pre></div></div><p>Neki first hashes the raw customer ID, then finds the range containing the resulting routing key.</p><p>Every data topology also names an <code>authoritative</code> group, a single-shard home for database-wide metadata such as sequences and schema information. Queries against <code>customers</code> still use <code>customer_data</code>.</p><h3 id="databases"><a href="https://planetscale.com/blog/what-is-a-data-topology#databases">Databases</a></h3><p>The <code>databases</code> section follows the familiar PostgreSQL hierarchy of databases, schemas, and tables.</p><p>Most tables do not need to appear in the data topology. An unlisted table inherits the default shard group from its schema, then its database, then the cluster, allowing a topology to shard an entire database with one default and list only the exceptions.</p><p>Put together, the explicit entry for <code>store.public.customers</code> maps it to <code>customer_data</code>, where it uses the <code>customer_id_xxhash</code> shard index and the group’s key ranges.</p><h2 id="the-foundation-of-neki-internals"><a href="https://planetscale.com/blog/what-is-a-data-topology#the-foundation-of-neki-internals">The foundation of Neki internals</a></h2><p>On one side of a Neki router is the user&#x27;s application, speaking the PostgreSQL wire protocol. On the other, the application&#x27;s data can be spread across an ever-growing number of physical shards.</p><p>The data topology connects the two, informing the router how data is divided and which shard or shards should receive a query. The result is a live configuration that maps logical databases to physical locations. Neki updates it during resharding, table moves, and imports, all while the application continues serving traffic.</p><p>From here, we can explore the rest of Neki’s architecture and how it helps <a href="https://planetscale.com/blog/making-768-servers-look-like-1">make 768 servers look like 1</a>.</p><p>Running PostgreSQL at scale? Request access to <a href="https://neki.dev/">Neki</a>.</p>]]></content>
    <summary><![CDATA[A data topology describes the sharding scheme a Neki router uses to map logical PostgreSQL tables to physical shards and route queries.]]></summary>
  </entry>
  <entry>
    <title>Concurrency vs. Throughput: why more parallelism can make databases slower</title>
    <link href="https://planetscale.com/blog/concurrency-vs-throughput-vitess-mysql"/>
    <id>https://planetscale.com/blog/concurrency-vs-throughput-vitess-mysql</id>
    <published>2026-08-07T00:00:00.000Z</published>
    <updated>2026-08-07T00:00:00.000Z</updated>
    <author>
      <name>Liz van Dijk</name>
    </author>
    <category term="engineering"/>
    <content type="html"><![CDATA[<p>Not long ago we watched a production MySQL database melt down for sixteen minutes.</p><p>The errors started as a trickle, a handful per minute, then fed on themselves:</p><div class="code-block"><div class="min-w-0 max-w-full"><pre class="shiki shiki-themes planetscale-light planetscale-dark" style="--shiki-light:#2b2b2b;--shiki-dark:#e1e1e1;--shiki-light-bg:#ebebeb;--shiki-dark-bg:#1a1a1a" tabindex="0"><code><span class="line"><span>minute   errors/min   queries/s</span></span>
<span class="line"><span>  0          5          15,000   &#x3C;- a burst of work arrives</span></span>
<span class="line"><span>  2         60           3,900</span></span>
<span class="line"><span>  4        300           2,500</span></span>
<span class="line"><span>  6        550           2,000</span></span>
<span class="line"><span>  8        900           1,900</span></span>
<span class="line"><span> 10      1,400           1,500   &#x3C;- error peak = throughput trough</span></span>
<span class="line"><span> 12        700           1,700</span></span>
<span class="line"><span> 14        250           2,000</span></span>
<span class="line"><span> 16          0           2,500   &#x3C;- locks released, backlog drained</span></span>
<span class="line"><span> 18          0           8,500   &#x3C;- full recovery, throughput jumps 5x</span></span>
<span class="line"><span></span></span></code></pre></div></div><p>The trigger was fairly mundane: A batch job opened a transaction against a hot table, took row locks, and then held them for fifteen minutes without committing. A common application bug, the kind that eventually sneaks into many large codebases.</p><p>What happened around this long transaction is the interesting bit! The queries piling up behind that transaction were mostly not blocked on its locks at all. They were simple reads, where InnoDB didn&#x27;t need to wait for row locks; it reads a consistent snapshot instead. Building that snapshot means walking back through the version history of every row the open transaction had touched, and that history grew for fifteen straight minutes.</p><p>This caused reads that normally took milliseconds to start blowing through their 90-second execution ceilings. The application retried them in a tight loop. Within minutes, more than ten thousand requests were piled up inside the storage engine. Processing each required reconstructing ever-longer version chains, and the resulting page reads outpaced the buffer pool&#x27;s ability to free memory.</p><p>Now requests that had nothing to do with the locked rows, that touched entirely different tables, began failing too. The otherwise correctly sized buffer pool suddenly became too small to serve the crowd of queries.</p><p>At PlanetScale, we run our MySQL databases with Vitess, whose configured transaction timeout eventually killed the long-running transaction. Its locks were released, and the sixteen-minute backlog drained in about thirty seconds.</p><p>One slow transaction should not take down a database, and much of Vitess&#x27;s plumbing is built around avoiding exactly this situation. So what went wrong? This was caused by the combination of the single long-running query and the ten thousand requests allowed in after.</p><h2 id="migration-from-cloud-sql-to-vitess"><a href="https://planetscale.com/blog/concurrency-vs-throughput-vitess-mysql#migration-from-cloud-sql-to-vitess">Migration from Cloud SQL to Vitess</a></h2><p>Some context on how a seemingly healthy database could end up like this in the first place.</p><p>This workload had recently been migrated onto PlanetScale from Cloud SQL, which ran Managed Connection Pooling, a thread-pool-style layer, in front of the database. A thread pool caps how many statements execute at once, commonly around a thousand, and queues the rest. A client arriving when the pool is full waits for a slot, usually for milliseconds, occasionally for a few hundred milliseconds. This cap can protect InnoDB&#x27;s internals even under extreme load.</p><p>On PlanetScale, every MySQL shard sits behind a Vitess proxy called <a href="https://vitess.io/docs/reference/programs/vttablet/">vttablet</a>. These have a transaction pool, which caps how many transactions can be open against MySQL at once. Unlike a thread pool, when this pool fills, requests wait a set amount of time and then <em>fail with an error</em>.</p><p>For this workload, that small difference made the issue way worse. Errors propagated up an application stack that had never needed to handle them (since the Cloud SQL thread pool queued requests, pool-full errors effectively didn&#x27;t exist there).</p><p>The solution that was initially tried was to <strong>raise the transaction pool cap and increase the timeout</strong>.</p><p>The pool was increased to ten thousand, a number chosen not by sizing but because it made the errors stop. However, this now limited Vitess&#x27;s ability to control the backpressure between the application and the database storage engine.</p><h2 id="why-high-concurrency-reduces-mysql-throughput"><a href="https://planetscale.com/blog/concurrency-vs-throughput-vitess-mysql#why-high-concurrency-reduces-mysql-throughput">Why high concurrency reduces MySQL throughput</a></h2><p>Picture database transactions as items flowing down a conveyor belt (Factorio, anyone?). If they never interacted, throughput would scale in a straight line: twice the items in flight, twice the work done. That is the dream of a perfectly <a href="https://en.wikipedia.org/wiki/Shared-nothing_architecture">shared-nothing</a> system, but rarely is that achieved. Somewhere on the belt there is a junction where multiple conveyor belts meet. In MySQL, this is the equivalent of a hot row, a latch, a CPU run queue, etc.</p><p>Below is a simple playground to visualize how request rate and queuing impact latency. Adjust the <code>ARRIVALS / S</code> slider to see the impact.</p><iframe src="https://planetscale.com/blog/doing-more-with-less/iframe#junction" title="Interactive: rising load against a single junction" loading="lazy"></iframe><p><a href="https://en.wikipedia.org/wiki/Little%27s_law">Little&#x27;s Law</a> describes this well. In steady state, <code>N = X * W</code>. Work-in-flight equals throughput times the time each request spends inside the database. Rearranged, <code>X = N / W</code>.</p><p>Adding in-flight requests raises throughput only as long as query execution time holds steady. If each new arrival stretches the execution/wait time of all the other queries within the database, the denominator now grows along with the numerator.</p><p>Just how badly can that go? <a href="https://www.perfdynamics.com/Manifesto/USLscalability.html">Gunther&#x27;s Universal Scalability Law</a> splits the cost of concurrency into three terms:</p><div class="code-block"><div class="min-w-0 max-w-full"><pre class="shiki shiki-themes planetscale-light planetscale-dark" style="--shiki-light:#2b2b2b;--shiki-dark:#e1e1e1;--shiki-light-bg:#ebebeb;--shiki-dark-bg:#1a1a1a" tabindex="0"><code><span class="line"><span>                 γN</span></span>
<span class="line"><span>X(N) = ───────────────────────────</span></span>
<span class="line"><span>        1 + α(N−1) + βN(N−1)</span></span>
<span class="line"><span></span></span></code></pre></div></div><ul><li><code>N</code> is how much work you allow to run at once.</li><li><code>γ</code> is the ideal single-request throughput: the linear scaling coefficient if requests never interacted.</li><li><code>α</code> (contention) is the cost of taking turns for a shared resource.</li><li><code>β</code> (coherency) is the cost of requests making <em>each other</em> slower. Put differently, the work a database must do to keep shared state consistent across everything in flight.</li></ul><p>Note the multiplier <code>N(N−1)</code>, which grows with the number of <em>pairs</em> of requests. When <code>N</code> doubles, this coherency cost roughly quadruples.</p><p>Past a critical point, <code>N_max = √((1−α)/β)</code>, <code>β</code> dominates, and total throughput actually starts to reverse. Gunther calls it retrograde scaling: beyond the peak, every request you admit requires coordination overhead and makes everything slower.</p><iframe src="https://planetscale.com/blog/doing-more-with-less/iframe#usl-curve" title="Interactive: the Universal Scalability Law curve" loading="lazy"></iframe><p>Let&#x27;s look at how the problem from earlier maps to this equation. The row locks were <code>α</code>. The transactions that wanted those rows had to take turns, and no amount of concurrency changed the queue&#x27;s drain rate. <code>β</code>, the real issue, was InnoDB trying to process so many queries at once: ten thousand concurrent snapshot reads, each made more expensive by the version history every <em>other</em> in-flight transaction was generating. The per-request cost rose with the increase in in-flight requests.</p><p>This is why focusing on &quot;lock contention&quot; does not explain the issue. The lock is just one of many potential junctions. It is the damage <em>around</em> the junction, the mutual slowdown of everything admitted past it, that scales with the square of concurrency and turns a slow batch job into a wider outage.</p><h2 id="reducing-pool-size-and-implementing-queuing"><a href="https://planetscale.com/blog/concurrency-vs-throughput-vitess-mysql#reducing-pool-size-and-implementing-queuing">Reducing pool size and implementing queuing</a></h2><p>To solve this, we implemented the reverse of the change that set this up, in both dimensions at once:</p><ol><li>Reduce the Vitess transaction pool size from ten thousand to roughly the thousand the old thread pool used. We now did this consciously and with evidence-backed proof: that workload had run successfully for years with a pool of that size.</li><li>Instead of erroring after waiting, a transaction arriving at a full pool now queues for a slot with a longer timeout.</li></ol><p>In other words, we configured Vitess&#x27;s vttablet layer to mimic the old thread pool&#x27;s behavior.</p><p>For this to be safe, two things must be true. The clients have to tolerate periodic waiting during bursts and the wait itself has to be bounded, so that a truly undersized system announces itself with timeouts at the queue rather than accumulating latency forever. Both are true for this workload.</p><p>The morning after rolling out this new configuration, it met its first test. A traffic burst arrived on a different Vitess shard of the same database, one that handles an order of magnitude more steady traffic. At peak, the pool handled around twenty-five thousand transaction pool slot requests <em>per second</em> against its thousand-odd available slots. Here are the results, in the same view we opened with:</p><div class="code-block"><div class="min-w-0 max-w-full"><pre class="shiki shiki-themes planetscale-light planetscale-dark" style="--shiki-light:#2b2b2b;--shiki-dark:#e1e1e1;--shiki-light-bg:#ebebeb;--shiki-dark-bg:#1a1a1a" tabindex="0"><code><span class="line"><span>minute   slot requests/s   errors/min   queries/s</span></span>
<span class="line"><span>  0             3,000           0         58,000</span></span>
<span class="line"><span> 10             9,000           0         61,000</span></span>
<span class="line"><span> 20            26,000           0         60,000   &#x3C;- peak pressure, throughput flat</span></span>
<span class="line"><span> 30            17,000           0         59,000</span></span>
<span class="line"><span> 40             8,000           0         62,000</span></span>
<span class="line"><span> 50             4,000           0         60,000</span></span>
<span class="line"><span> 60             2,000           0         57,000   &#x3C;- burst drained, queue empty</span></span>
<span class="line"><span></span></span></code></pre></div></div><p>During the earlier incident, errors climbed to 1,400 a minute and throughput fell to a tenth of what the workload requested.</p><p>With the new and improved configuration, the application experienced no disruption and QPS didn&#x27;t drop.</p><p>Over the entire day, database health was much better:</p><ul><li><strong>One rejected transaction.</strong> Despite slot requests/s at times jumping as high as 40,000, the queue absorbed effectively everything. Waits sat comfortably within the timeout.</li><li><strong>Fewer than two hundred statements executing inside MySQL at any instant.</strong> InnoDB managed the bursts well. Sixty thousand queries a second through fewer than two hundred concurrent slots is Little&#x27;s Law again: about three milliseconds apiece.</li><li><strong>Lock contention didn&#x27;t change.</strong> The hot-row pattern was just a minor contributor here. We were able to solve the problem without changing the lock contention dynamics.</li></ul><p>This allowed the database to do less work <em>at once</em>, allowing it to do more work in total.</p><p>Below is another playground to visualize the difference between an open request flow and a gated one. Send bursts of traffic, simulate a locking event, and see the difference between a gated and ungated solution with the buttons below.</p><iframe src="https://planetscale.com/blog/doing-more-with-less/iframe#before-after" title="Interactive: same workload, opposite overflow behavior" loading="lazy"></iframe><h2 id="when-to-limit-database-concurrency"><a href="https://planetscale.com/blog/concurrency-vs-throughput-vitess-mysql#when-to-limit-database-concurrency">When to limit database concurrency</a></h2><p>This is not a universal recommendation to tightly limit concurrency. Its applicability must be understood in the context of your workload.</p><ul><li>Workloads built on pessimistic locking and contended shared state.</li><li>Hot rows updated by many workers.</li><li><code>SELECT ... FOR UPDATE</code> on popular keys.</li><li>Long transactions holding locks while they do unrelated work.</li><li>Counters, balances, job queues.</li></ul><p>If that describes your workload, added concurrency might just decrease your throughput!</p><p>The principles described here are not MySQL-specific. Postgres can have similar problems, but also a similar solution: <a href="https://planetscale.com/docs/postgres/connecting/pgbouncer">PgBouncer</a>&#x27;s transaction pooling exists to allow for more client concurrency than server concurrency. This is why our <a href="https://planetscale.com/docs/postgres">Postgres offering</a> comes with a local PgBouncer, and can be configured with dedicated primary and replica PgBouncer instances too.</p><h2 id="building-systems-that-handle-backpressure"><a href="https://planetscale.com/blog/concurrency-vs-throughput-vitess-mysql#building-systems-that-handle-backpressure">Building systems that handle backpressure</a></h2><p><strong>Backpressure can&#x27;t always be avoided, so make conscious choices about the expected behavior.</strong> The answer is almost never to simply raise a limit out of reach, but to fix what happens when that limit is reached.</p><p>Sometimes the fastest thing you can do for a busy system is to simply let less happen at once.</p>]]></content>
    <summary><![CDATA[Increasing throughput sometimes requires reducing parallelism. A look into why this is the case for Vitess + MySQL databases]]></summary>
  </entry>
  <entry>
    <title>Massively parallel Postgres backups</title>
    <link href="https://planetscale.com/blog/massively-parallel-postgres-backups"/>
    <id>https://planetscale.com/blog/massively-parallel-postgres-backups</id>
    <published>2026-07-31T00:00:00.000Z</published>
    <updated>2026-07-31T00:00:00.000Z</updated>
    <author>
      <name>Ben Dicken</name>
    </author>
    <category term="engineering"/>
    <content type="html"><![CDATA[<iframe src="https://planetscale.com/blog/massively-parallel-postgres-backups/iframe#hero-sharded-database" title="/blog/massively-parallel-postgres-backups/iframe#hero-sharded-database" loading="lazy"></iframe><p>Every 12 hours, a backup system must turn the entire state of a busy database into a consistent, encrypted snapshot, with no impact to production queries.</p><p>Such backups are crucially important and simultaneously something that most engineers would rather never have to think about.</p><p><em>Just make the backup work</em>.</p><p>Our goal at PlanetScale is to make taking, scheduling, managing, and restoring Postgres and MySQL backups effortless.</p><p>Though this is what our customers experience from the outside, achieving this internally requires careful orchestration of cloud infrastructure and DBMS tooling.</p><p>It&#x27;s especially interesting to look at backups for sharded databases, which requires spinning up backup-specific nodes, pulling data from object storage, and WAL replay, all with massive parallelism. These techniques allow for petabyte-scale databases to be backed up in hours, at rates over 50 GB/s.</p><p>Here we take a behind-the-curtain look at how to effectively back up a sharded database with massive parallelism.</p><h2 id="the-backup-lifecycle"><a href="https://planetscale.com/blog/massively-parallel-postgres-backups#the-backup-lifecycle">The backup lifecycle</a></h2><p>Here is an example of a Neki (sharded Postgres) database with 8 shards, happily handling hundreds of thousands of queries per second of production traffic.</p><iframe src="https://planetscale.com/blog/massively-parallel-postgres-backups/iframe#sharded-database" title="/blog/massively-parallel-postgres-backups/iframe#sharded-database" loading="lazy"></iframe><p>If sharding is a new concept to you, check out our recent post <a href="https://planetscale.com/blog/making-768-servers-look-like-1">Making 768 servers look like 1</a> on how it all works. The first step in taking a backup depends on whether this is the <em>very first backup</em> or if we&#x27;ve taken one previously. We&#x27;ll start with the steady-state case, which assumes a prior healthy backup already captured and stored in Amazon S3 (or similar object storage in other clouds).</p><p>Since a sharded Postgres database is many individual primary Postgres servers working together, we use regular Postgres backups as the building block for large-scale backups with Neki.</p><p>There are three ways to take backups in Postgres, which we&#x27;ve <a href="https://planetscale.com/blog/postgres-backups-under-the-hood">written about in detail previously</a>. The best of the three, and the one that Neki uses, is combining filesystem backups with the replay of archived Write-Ahead Log (WAL). To summarize, the steps for this are:</p><ol><li>Begin a full backup of the on-disk Postgres database files at time <code>T1</code></li><li>The backup completes at time <code>T2</code>; between <code>T1</code> and <code>T2</code>, rows on disk may have been mutated</li><li>Replay the write-ahead log modifications between <code>T1</code> and <code>T2</code> to correct mutated data</li><li>Store the final result in a distinct storage location like Amazon S3</li></ol><p>We <em>could</em> complete these steps directly on the primary, or perhaps one of the traffic-serving replicas. The problem is that this task utilizes a significant amount of IOPS and compute, especially for a large database. Our goal should be to minimize the impact a backup will have on production query serving.</p><p>Because of this, we take a different approach. We spin up a <span class="bg-yellow-100/70 text-yellow-700 dark:bg-yellow-800 dark:text-yellow-300">brand new set of EC2 instances</span>, one per shard, to manage the backups on.</p><iframe src="https://planetscale.com/blog/massively-parallel-postgres-backups/iframe#sharded-database-backup-servers" title="/blog/massively-parallel-postgres-backups/iframe#sharded-database-backup-servers" loading="lazy"></iframe><p>These <span class="bg-yellow-100/70 text-yellow-700 dark:bg-yellow-800 dark:text-yellow-300">new instances</span> will be responsible for the majority of the work in the backup. Because we operate these sharded databases in clouds like AWS and GCP, dynamically spinning up tens or hundreds of instances for short time slices to complete backups is achievable. It adds a small amount of cost, but is worth it to minimize negative production impact.</p><h2 id="reusing-old-backups"><a href="https://planetscale.com/blog/massively-parallel-postgres-backups#reusing-old-backups">Reusing old backups</a></h2><p>The next step is restoring the most recent backup to each shard. Prior backups are stored in object storage. Here we will use <span class="bg-orange-100/80 text-orange-700 dark:bg-orange-800/70 dark:text-orange-200">Amazon S3</span> as the example, but the same applies to other clouds (like GCS in Google Cloud). These are streamed directly from here.</p><iframe src="https://planetscale.com/blog/massively-parallel-postgres-backups/iframe#sharded-database-s3-copy" title="/blog/massively-parallel-postgres-backups/iframe#sharded-database-s3-copy" loading="lazy"></iframe><p>This approach requires temporary compute and transfers each shard&#x27;s data out of and back into object storage. We accept that cost for two important reasons:</p><ul><li>Only recent WAL comes from the primary, minimizing production impact</li><li>Every cycle proves the previous backup can be restored and replayed</li></ul><p>Once all the copying completes, these 8 servers have the exact state of each of the 8 shards from the previous backup, 12 hours ago.</p><h2 id="replaying-the-wal"><a href="https://planetscale.com/blog/massively-parallel-postgres-backups#replaying-the-wal">Replaying the WAL</a></h2><p>We now must catch up each shard&#x27;s old backup to match the present state of the database. This requires replaying all changes from the Postgres Write-Ahead Log between 12 hours ago and now.</p><p>A naïve approach would be to pull the WAL directly from the primary. This is problematic for several reasons:</p><ol><li>This would have nontrivial production impact. Replaying 12 hours of WAL on a high-churn database could take tens of minutes, or even an hour+.</li><li>Because we don&#x27;t want too much server storage consumed by WAL, we continuously archive it to S3. Thus, we likely don&#x27;t even have the full past 12 hours of WAL resident on the primary node.</li></ol><p>On PlanetScale, all Postgres databases use <a href="https://wal-g.readthedocs.io/PostgreSQL/"><code>wal-g</code></a> to <span class="bg-blue-100/80 text-blue-700 dark:bg-blue-800/80 dark:text-blue-300">continuously archive</span> their write-ahead logs. A sharded Neki database is similar, except each shard has a distinct WAL archive stream.</p><iframe src="https://planetscale.com/blog/massively-parallel-postgres-backups/iframe#sharded-database-continuous-wal-archive" title="/blog/massively-parallel-postgres-backups/iframe#sharded-database-continuous-wal-archive" loading="lazy"></iframe><p>What if we streamed from there instead?</p><p>This almost solves the problem. The remaining problem is that Postgres archives WAL only after a segment is complete. If write traffic doesn&#x27;t fill a segment sooner, our five-minute <code>archive_timeout</code> setting forces a segment switch so it can be archived. This means the newest changes may not have reached S3 yet. Thus, we take a hybrid approach. The system uses S3 for the majority of the replay, then streams the last ~few minutes of changes directly from the primary. Ideally, this last step takes on the order of seconds, not minutes or hours.</p><p>Putting this step together, back in our sharded database:</p><iframe src="https://planetscale.com/blog/massively-parallel-postgres-backups/iframe#sharded-database-wal-catch-up" title="/blog/massively-parallel-postgres-backups/iframe#sharded-database-wal-catch-up" loading="lazy"></iframe><h2 id="completing-the-cycle"><a href="https://planetscale.com/blog/massively-parallel-postgres-backups#completing-the-cycle">Completing the cycle</a></h2><p>When every node has caught up replication to time <code>T</code>, where <code>T</code> is the timestamp we will log for the backup time, we stop WAL replication, freezing the point-in-time of the backup. Time <code>T</code> is saved to ensure we know the precise time, down to the second, included in this backup. The full backup is now consistent, with no smeared data. The final step is to encrypt and send these backups off to a new S3 bucket for safe keeping.</p><iframe src="https://planetscale.com/blog/massively-parallel-postgres-backups/iframe#sharded-database-s3-offload" title="/blog/massively-parallel-postgres-backups/iframe#sharded-database-s3-offload" loading="lazy"></iframe><p>When complete, the backup nodes have served their purpose, and are decommissioned.</p><h2 id="the-initial-backup"><a href="https://planetscale.com/blog/massively-parallel-postgres-backups#the-initial-backup">The initial backup</a></h2><p>The cycle just described assumed we had a good backup from 12 hours prior to start with. In the steady-state this is true, but not for a brand new database.</p><p>Within 12 hours of a new database creation, <code>pg_basebackup</code> is used to seed a backup node for each shard.</p><p><code>pg_basebackup</code> is a built-in PostgreSQL client utility that takes a physical backup of the entire database cluster: the data directory, tablespaces, and configuration needed for recovery.</p><p>Why not upload the <code>pg_basebackup</code> output directly? We use it only to seed the temporary backup nodes. The durable backup is created with <code>wal-g</code>, keeping the format and restore process identical for initial and steady-state backups.</p><p>The steps for this first one are similar, but slightly different than the steady-state:</p><ol><li>Spin up one new EC2 instance per shard.</li><li>Run <code>pg_basebackup</code> on each instance to copy data from its primary.</li><li>Configure each instance to replicate from its primary.</li><li>Replay WAL until every instance catches up.</li><li>Stop replication at time <code>T</code>.</li><li>Use <code>wal-g</code> to format, encrypt, and upload each backup to S3.</li></ol><p>Once this exists, all future backups happen with the restore -&gt; catch up -&gt; save flow.</p><h2 id="need-for-speed"><a href="https://planetscale.com/blog/massively-parallel-postgres-backups#need-for-speed">Need for speed</a></h2><p>Part of the reason we do so much parallelism is due to the nature of sharding. Whether it&#x27;s 4 shards or 400, since each shard contains its own Postgres primary, we may as well take a rock-solid system (regular Postgres backups) and do it over and over on each shard.</p><p>A side-effect of this is that backups are VERY fast, even for large databases.</p><p>For every backup, the data transfer steps are:</p><ol><li>Restore old backup from S3</li><li>Catch up the backup using a hybrid of S3 + the primary</li><li>Send the new file back to S3</li></ol><p>Consider what it would take to complete this backup cycle on an <em>unsharded</em> 32 terabyte database. Backups on PlanetScale are compressed and stored with encryption at rest in S3. We&#x27;ll assume that backups for this 32 terabyte database compress down to 20 terabytes. Therefore, we have</p><ol><li>20,000 GB transfer from S3</li><li>Catch up (Ex: 20 GB, compressed to 10 GB)</li><li>20,010 GB back to S3</li></ol><p>This equates to a total transfer volume of ~40,030 GB. If our various nodes and interconnects can sustain a 500 MBps transfer rate, this means the backup would take ~22 hours. Crucially, this means that if we want twice-daily backups, multiple backups would overlap. This would prevent us from meeting our recovery point objective (RPO).</p><p>This same database in Neki, spread over 8 shards storing ~4 TB each, performs quite differently. In total, we need to transfer, catch up, and store the same 40,030 GB. But if we can do so across 8 distinct backup nodes in parallel, each capable of 500 MBps, we reduce the total time to ~2.8 hours.</p><iframe src="https://planetscale.com/blog/massively-parallel-postgres-backups/iframe#parallel-backup-speed" title="/blog/massively-parallel-postgres-backups/iframe#parallel-backup-speed" loading="lazy"></iframe><p>This gets better the more shards you add. The same data spread across 32 shards would back up in 42 minutes. Backup speed scales well. 100 terabytes on 100 shards backs up at ~the same speed as 1 terabyte on a single shard.</p><h2 id="what-are-backups-used-for"><a href="https://planetscale.com/blog/massively-parallel-postgres-backups#what-are-backups-used-for">What are backups used for?</a></h2><p>One reason to take backups is data safety. In the case of accidental data deletion or a one-in-a-million database disaster, backups (and the WAL) are an essential fallback.</p><p>But at PlanetScale, backups are also a core part of everyday database operations. For <a href="https://planetscale.com/metal">Metal</a> databases specifically (ones with Local NVMe), backups are also used every time the database is resized.</p><p>Resizing a Metal database requires:</p><ol><li>For every existing node in the sharded database, spin up a brand-new EC2 instance at the new size. In a database with 8 shards each with a primary and 2 replicas, we may currently be running it on <code>8 x 3 = 24</code> <code>i8g.xlarge</code> nodes. While running, we initialize 24 additional <code>i8g.2xlarges</code> to double the compute capacity.</li><li>Each of the 24 new nodes pulls down a copy of the most recent backup from S3, and begins catching up to the present state of the database via the archived WAL.</li><li>All nodes are initialized as standbys of the original primary, and complete final replication catch-up.</li><li>When all nodes are synchronized with the primary, a switchover is made from the old <code>i8g.xlarge</code> primary to a selected new <code>i8g.2xlarge</code> primary.</li><li>The smaller nodes are decommissioned, leaving only the larger primary and replicas.</li></ol><iframe src="https://planetscale.com/blog/massively-parallel-postgres-backups/iframe#sharded-database-resize-cycle" title="/blog/massively-parallel-postgres-backups/iframe#sharded-database-resize-cycle" loading="lazy"></iframe><p>We&#x27;ve now completed a full resize across all shards. Backups are used to facilitate the creation / catch-up of the new nodes. This process can take anywhere from minutes to hours, depending on how large the backups are and how much WAL there is to replay.</p><p>Backups are also used when a node needs to be replaced due to unexpected failure. If your average server lifetime is 5 years, you&#x27;ll rarely notice a failure on a small database with a single primary. For a database with hundreds of shards, each with multiple replicas, the statistical likelihood for node failure in a given week or month increases significantly. When we see an individual node fail (say, a single replica in a shard), the process for replacement looks like:</p><ol><li>Initialize a new cloud instance of the same size as the previously failed one.</li><li>Use the process described earlier to restore a recent back-up to it, catch up the WAL.</li><li>Initialize as a follower of the original primary, synchronize data.</li><li>This new node can now actively serve read queries and/or serve as a new primary during a switchover or failover operation.</li></ol><h2 id="what-about-mysql"><a href="https://planetscale.com/blog/massively-parallel-postgres-backups#what-about-mysql">What about MySQL?</a></h2><p>Everything here has been about how we complete sharded backups and resizes on Postgres databases, powered by Neki. PlanetScale also operates large-scale sharded MySQL databases, powered by Vitess as our query routing / sharding layer.</p><p>The process for backing up and resizing these databases is quite similar! We have a <a href="https://planetscale.com/blog/faster-backups-with-sharding">whole separate blog</a> on how this works, but the main difference is that we use <code>VTBackup</code> instead of the Postgres backup builtins, we use the <a href="https://dev.mysql.com/doc/refman/en/binary-log.html">MySQL binary log</a> replication instead of WAL, and replication catchup is done from the primary instead of a hybrid between S3 and primary.</p><h2 id="make-it-boring"><a href="https://planetscale.com/blog/massively-parallel-postgres-backups#make-it-boring">Make it boring</a></h2><p>Ultimately, we want all this to be transparent to you. Taking a backup should be as easy as an automated schedule, or clicking a button. Resizing a database should be a single click or API call.</p><p>However, we also have a deep appreciation for the finer details of database operations. By taking a journey through the lifecycle of backups, we hope you have a new-found appreciation for how incredible database orchestration is.</p><p>If you find this fascinating, we&#x27;re always looking for <a href="https://planetscale.com/careers">talented database engineers</a>.</p>]]></content>
    <summary><![CDATA[PlanetScale backs up petabyte-scale sharded Postgres databases in hours using parallel infrastructure, object storage, and WAL replay.]]></summary>
  </entry>
  <entry>
    <title>Postgres backups under the hood</title>
    <link href="https://planetscale.com/blog/postgres-backups-under-the-hood"/>
    <id>https://planetscale.com/blog/postgres-backups-under-the-hood</id>
    <published>2026-07-24T00:00:00.000Z</published>
    <updated>2026-07-24T00:00:00.000Z</updated>
    <author>
      <name>Josh Brown</name>
    </author>
    <category term="engineering"/>
    <content type="html"><![CDATA[<p>Data integrity is one of the most important pillars for a database system. If your database goes down, backups are how you stay safe and recover in case of disaster.</p><p>Backups should be taken often, and recovery needs to stay fast. With backups being such a vital part of keeping your data safe, you should know how they work.</p><h2 id="the-types-of-postgres-backups"><a href="https://planetscale.com/blog/postgres-backups-under-the-hood#the-types-of-postgres-backups">The types of Postgres backups</a></h2><p>There are <a href="https://www.postgresql.org/docs/current/backup.html">three different ways</a> to back up a Postgres database: Logical backups (<code>pg_dump</code>), file system backups, and continuous archiving.</p><h2 id="logical-backups"><a href="https://planetscale.com/blog/postgres-backups-under-the-hood#logical-backups">Logical backups</a></h2><p><code>pg_dump</code> is a purely logical backup that exports a consistent snapshot of the database, and is the simplest way to back up a Postgres database. At its core, <code>pg_dump</code> reads the current state of the database and writes the data to a given output.</p><p><code>pg_dump</code> can create dumps in either plain text as SQL statements (with SQL queries such as COPY or INSERT), or custom <code>pg_dump</code> formats designed for use with <code>pg_restore</code>.</p><p>Regardless of the format used, the data <code>pg_dump</code> outputs is instructions on how to rebuild the data in the database.</p><div class="code-block" data-language="sql"><div class="min-w-0 max-w-full"><pre class="shiki shiki-themes planetscale-light planetscale-dark" style="--shiki-light:#2b2b2b;--shiki-dark:#e1e1e1;--shiki-light-bg:#ebebeb;--shiki-dark-bg:#1a1a1a" tabindex="0"><code><span class="line"><span style="--shiki-light:#818181;--shiki-dark:#A1A1A1">-- An abbreviated snippet of output from pg_dump in plain format</span></span>
<span class="line"><span style="--shiki-light:#F35815;--shiki-dark:#F35815">CREATE</span><span style="--shiki-light:#F35815;--shiki-dark:#F35815"> TABLE</span><span style="--shiki-light:#5E49AF;--shiki-dark:#B7A5FB"> public</span><span style="--shiki-light:#2B2B2B;--shiki-dark:#E1E1E1">.customers (</span></span>
<span class="line"><span style="--shiki-light:#2B2B2B;--shiki-dark:#E1E1E1">    id </span><span style="--shiki-light:#F35815;--shiki-dark:#F35815">bigint</span><span style="--shiki-light:#F35815;--shiki-dark:#F35815"> NOT NULL</span><span style="--shiki-light:#2B2B2B;--shiki-dark:#E1E1E1">,</span></span>
<span class="line"><span style="--shiki-light:#F35815;--shiki-dark:#F35815">    name</span><span style="--shiki-light:#F35815;--shiki-dark:#F35815"> text</span><span style="--shiki-light:#F35815;--shiki-dark:#F35815"> NOT NULL</span><span style="--shiki-light:#2B2B2B;--shiki-dark:#E1E1E1">,</span></span>
<span class="line"><span style="--shiki-light:#2B2B2B;--shiki-dark:#E1E1E1">    email </span><span style="--shiki-light:#F35815;--shiki-dark:#F35815">text</span><span style="--shiki-light:#F35815;--shiki-dark:#F35815"> NOT NULL</span><span style="--shiki-light:#2B2B2B;--shiki-dark:#E1E1E1">,</span></span>
<span class="line"><span style="--shiki-light:#2B2B2B;--shiki-dark:#E1E1E1">    country </span><span style="--shiki-light:#F35815;--shiki-dark:#F35815">text</span><span style="--shiki-light:#F35815;--shiki-dark:#F35815"> NOT NULL</span><span style="--shiki-light:#2B2B2B;--shiki-dark:#E1E1E1">,</span></span>
<span class="line"><span style="--shiki-light:#2B2B2B;--shiki-dark:#E1E1E1">    created_at </span><span style="--shiki-light:#F35815;--shiki-dark:#F35815">timestamp with time zone</span><span style="--shiki-light:#F35815;--shiki-dark:#F35815"> NOT NULL</span></span>
<span class="line"><span style="--shiki-light:#2B2B2B;--shiki-dark:#E1E1E1">);</span></span>
<span class="line"></span>
<span class="line"><span style="--shiki-light:#F35815;--shiki-dark:#F35815">ALTER</span><span style="--shiki-light:#F35815;--shiki-dark:#F35815"> TABLE</span><span style="--shiki-light:#7D5903;--shiki-dark:#FED54A"> public</span><span style="--shiki-light:#2B2B2B;--shiki-dark:#E1E1E1">.</span><span style="--shiki-light:#7D5903;--shiki-dark:#FED54A">customers</span><span style="--shiki-light:#F35815;--shiki-dark:#F35815"> OWNER</span><span style="--shiki-light:#F35815;--shiki-dark:#F35815"> TO</span><span style="--shiki-light:#2B2B2B;--shiki-dark:#E1E1E1"> postgres;</span></span>
<span class="line"></span>
<span class="line"><span style="--shiki-light:#F35815;--shiki-dark:#F35815">COPY</span><span style="--shiki-light:#7D5903;--shiki-dark:#FED54A"> public</span><span style="--shiki-light:#2B2B2B;--shiki-dark:#E1E1E1">.</span><span style="--shiki-light:#7D5903;--shiki-dark:#FED54A">customers</span><span style="--shiki-light:#2B2B2B;--shiki-dark:#E1E1E1"> (id, </span><span style="--shiki-light:#F35815;--shiki-dark:#F35815">name</span><span style="--shiki-light:#2B2B2B;--shiki-dark:#E1E1E1">, email, country, created_at) </span><span style="--shiki-light:#F35815;--shiki-dark:#F35815">FROM</span><span style="--shiki-light:#2B2B2B;--shiki-dark:#E1E1E1"> stdin;</span></span>
<span class="line"><span style="--shiki-light:#D92038;--shiki-dark:#FF7082">1</span><span style="--shiki-light:#2B2B2B;--shiki-dark:#E1E1E1">	Customer </span><span style="--shiki-light:#D92038;--shiki-dark:#FF7082">1</span><span style="--shiki-light:#2B2B2B;--shiki-dark:#E1E1E1">	user1@example.com	UK	</span><span style="--shiki-light:#D92038;--shiki-dark:#FF7082">2020</span><span style="--shiki-light:#F35815;--shiki-dark:#F35815">-</span><span style="--shiki-light:#D92038;--shiki-dark:#FF7082">01</span><span style="--shiki-light:#F35815;--shiki-dark:#F35815">-</span><span style="--shiki-light:#D92038;--shiki-dark:#FF7082">02</span><span style="--shiki-light:#D92038;--shiki-dark:#FF7082"> 00</span><span style="--shiki-light:#2B2B2B;--shiki-dark:#E1E1E1">:</span><span style="--shiki-light:#D92038;--shiki-dark:#FF7082">00</span><span style="--shiki-light:#2B2B2B;--shiki-dark:#E1E1E1">:</span><span style="--shiki-light:#D92038;--shiki-dark:#FF7082">00</span><span style="--shiki-light:#F35815;--shiki-dark:#F35815">+</span><span style="--shiki-light:#D92038;--shiki-dark:#FF7082">00</span></span>
<span class="line"><span style="--shiki-light:#D92038;--shiki-dark:#FF7082">2</span><span style="--shiki-light:#2B2B2B;--shiki-dark:#E1E1E1">	Customer </span><span style="--shiki-light:#D92038;--shiki-dark:#FF7082">2</span><span style="--shiki-light:#2B2B2B;--shiki-dark:#E1E1E1">	user2@example.com	DE	</span><span style="--shiki-light:#D92038;--shiki-dark:#FF7082">2020</span><span style="--shiki-light:#F35815;--shiki-dark:#F35815">-</span><span style="--shiki-light:#D92038;--shiki-dark:#FF7082">01</span><span style="--shiki-light:#F35815;--shiki-dark:#F35815">-</span><span style="--shiki-light:#D92038;--shiki-dark:#FF7082">03</span><span style="--shiki-light:#D92038;--shiki-dark:#FF7082"> 00</span><span style="--shiki-light:#2B2B2B;--shiki-dark:#E1E1E1">:</span><span style="--shiki-light:#D92038;--shiki-dark:#FF7082">00</span><span style="--shiki-light:#2B2B2B;--shiki-dark:#E1E1E1">:</span><span style="--shiki-light:#D92038;--shiki-dark:#FF7082">00</span><span style="--shiki-light:#F35815;--shiki-dark:#F35815">+</span><span style="--shiki-light:#D92038;--shiki-dark:#FF7082">00</span></span>
<span class="line"><span style="--shiki-light:#2B2B2B;--shiki-dark:#E1E1E1">...</span></span>
<span class="line"></span></code></pre></div></div><p>Reading, formatting, and compressing a few gigabytes is trivial, but in the terabytes+ this becomes increasingly unfeasible. Even if your system can take a successful <code>pg_dump</code> backup at 30TB, it consumes a lot of resources. User queries must contend with <code>pg_dump</code> for CPU and IO, and in worst case scenarios this brings the database to a crawl.</p><div class="mb-3 border p-3 border-blue-600 dark:border-blue-500"><p><span class="bg-blue-600 px-sm text-white dark:bg-blue-500 dark:text-black">Note</span></p><p>Logical backups lack the ability to do point in time recovery (PITR) since the backup is a static snapshot of data at a given time. However, they are particularly useful for facilitating migrations.</p></div><p><code>pg_dump</code> connects to the database through a standard SQL connection, only saving the rows and schema inside the database. It does not save physical page layouts, dead tuples, stored index bytes, or cluster-wide roles/tablespaces. This generally keeps outputs from <code>pg_dump</code> smaller compared to other backup methods.</p><iframe src="https://planetscale.com/blog/postgres-backups-under-the-hood/pg-dump/iframe" title="pg_dump serializing rows into a dump file and restoring them into a fresh database" loading="lazy"></iframe><h3 id="logical-backups-and-transaction-wraparound"><a href="https://planetscale.com/blog/postgres-backups-under-the-hood#logical-backups-and-transaction-wraparound">Logical backups and transaction wraparound</a></h3><p>Logical backups leverage Postgres&#x27;s MVCC support in order to take a consistent backup while the database is online. If you&#x27;re not familiar with MVCC, read our blog on <a href="https://planetscale.com/blog/postgresql-mvcc">Postgres MVCC</a>. The section on <a href="https://planetscale.com/blog/postgresql-mvcc#the-transaction-horizon">transaction horizons</a> is particularly important here. When <code>pg_dump</code> starts, it opens a transaction in one of two ways:</p><div class="code-block" data-language="sql"><div class="min-w-0 max-w-full"><pre class="shiki shiki-themes planetscale-light planetscale-dark" style="--shiki-light:#2b2b2b;--shiki-dark:#e1e1e1;--shiki-light-bg:#ebebeb;--shiki-dark-bg:#1a1a1a" tabindex="0"><code><span class="line"><span style="--shiki-light:#818181;--shiki-dark:#A1A1A1">-- pg_dump with the default settings</span></span>
<span class="line"><span style="--shiki-light:#F35815;--shiki-dark:#F35815">BEGIN</span><span style="--shiki-light:#2B2B2B;--shiki-dark:#E1E1E1">;</span></span>
<span class="line"><span style="--shiki-light:#F35815;--shiki-dark:#F35815">SET</span><span style="--shiki-light:#F35815;--shiki-dark:#F35815"> TRANSACTION</span><span style="--shiki-light:#F35815;--shiki-dark:#F35815"> ISOLATION</span><span style="--shiki-light:#F35815;--shiki-dark:#F35815"> LEVEL</span><span style="--shiki-light:#F35815;--shiki-dark:#F35815"> REPEATABLE</span><span style="--shiki-light:#F35815;--shiki-dark:#F35815"> READ</span><span style="--shiki-light:#2B2B2B;--shiki-dark:#E1E1E1">, </span><span style="--shiki-light:#F35815;--shiki-dark:#F35815">READ</span><span style="--shiki-light:#2B2B2B;--shiki-dark:#E1E1E1"> ONLY;</span></span>
<span class="line"><span style="--shiki-light:#2B2B2B;--shiki-dark:#E1E1E1">...</span></span>
<span class="line"></span>
<span class="line"><span style="--shiki-light:#818181;--shiki-dark:#A1A1A1">-- pg_dump --serializable-deferrable </span></span>
<span class="line"><span style="--shiki-light:#818181;--shiki-dark:#A1A1A1">-- Ensures transactions are serializable while the backup is being taken.</span></span>
<span class="line"><span style="--shiki-light:#818181;--shiki-dark:#A1A1A1">-- Generally not recommended for backups intended for disaster recovery.</span></span>
<span class="line"><span style="--shiki-light:#818181;--shiki-dark:#A1A1A1">-- see the --serializable-deferrable flag for pg_dump</span></span>
<span class="line"><span style="--shiki-light:#818181;--shiki-dark:#A1A1A1">-- https://www.postgresql.org/docs/current/app-pgdump.html</span></span>
<span class="line"><span style="--shiki-light:#F35815;--shiki-dark:#F35815">BEGIN</span><span style="--shiki-light:#2B2B2B;--shiki-dark:#E1E1E1">;</span></span>
<span class="line"><span style="--shiki-light:#F35815;--shiki-dark:#F35815">SET</span><span style="--shiki-light:#F35815;--shiki-dark:#F35815"> TRANSACTION</span><span style="--shiki-light:#F35815;--shiki-dark:#F35815"> ISOLATION</span><span style="--shiki-light:#F35815;--shiki-dark:#F35815"> LEVEL</span><span style="--shiki-light:#F35815;--shiki-dark:#F35815"> SERIALIZABLE</span><span style="--shiki-light:#2B2B2B;--shiki-dark:#E1E1E1">, </span><span style="--shiki-light:#F35815;--shiki-dark:#F35815">READ</span><span style="--shiki-light:#2B2B2B;--shiki-dark:#E1E1E1"> ONLY, DEFERRABLE; </span></span>
<span class="line"><span style="--shiki-light:#2B2B2B;--shiki-dark:#E1E1E1">...</span></span>
<span class="line"></span></code></pre></div></div><p>Every transaction that modifies data gets assigned an internal id, referred to as its <code>xid</code>. Rows in the database contain a hidden variable named <code>xmin</code>. <code>xmin</code> informs Postgres of the <code>xid</code> for the transaction that modified that row, while <code>xmax</code> is which transaction deleted, updated or locked that row.</p><p>Although <code>pg_dump</code> may not get its own <code>xid</code>, it pins a transaction snapshot of the active <code>xid</code>s at that moment, giving the dump a consistent view of the database for its entire duration.</p><div class="mb-3 border p-3 border-blue-600 dark:border-blue-500"><p><span class="bg-blue-600 px-sm text-white dark:bg-blue-500 dark:text-black">Note</span></p><p><code>txid</code> is the 8 byte ID used for tracking transactions that modify data. <code>xid</code> is the lower 4 bytes of <code>txid</code> and is stored in tuples on disk as <code>xmin</code>, <code>xmax</code>, or in other variables.</p></div><p>Remember that <code>xid</code>s are 32-bit integers used to track the historical version of rows (or tuples, technically) across transactions. Tuples are the underlying representation of a row on disk. 32 bits can only represent a maximum of ~4 billion numbers, so what happens after we have more than 4 billion transactions?</p><p>Postgres treats <code>xid</code>s as a circular range. Quoting from <a href="https://www.depesz.com/2024/03/18/what-the-hell-is-transaction-wraparound/">depesz&#x27;s article</a> on transaction wraparound:</p><blockquote><p>Let&#x27;s explain this bit on smaller numbers. Let&#x27;s assume that we have the whole range of 0 to 10. Only 11 xids. If my current xid is 5, then xids 0..4 are in the past, and 6..10 are in the future. And if current xid is 3? Future is simple: 4..8. But past now contains two ranges: 0..2, and 9..10. Similarly, if current xid is 9, then past xids will be 4..8, and future would be 10, 0..3.</p><p><a href="https://www.depesz.com/2024/03/18/what-the-hell-is-transaction-wraparound/">depesz</a></p></blockquote><p>To keep the range circular and <code>xid</code>s reusable, Postgres uses a freeze bit. This bit marks a tuple as older than any running transaction or snapshot, and should always be read as an &quot;old&quot; tuple.</p><p>When <code>autovacuum</code> runs, it internally calls an internal Postgres function <code>GetOldestNonRemovableTransactionId()</code>. This finds the oldest <code>xid</code> that is assigned to an open transaction, otherwise known as the transaction horizon, and <code>autovacuum</code> will go and freeze tuples &quot;older&quot; than that given xid.</p><p>A unique situation arises when the following criteria are met:</p><ul><li>A long running open transaction pins the transaction horizon</li><li>More than ~2 billion new transactions have started after the long running transaction</li></ul><p>If both of these points are met, new transactions start seeing old unfrozen tuples as if they were written by future transactions. This is called a transaction wraparound. At this point, Postgres will refuse new commands that would create <code>xid</code>s, triggering read-only mode to ensure no data loss actually occurs.</p><p>Since <code>pg_dump</code> holds its snapshot open for the entire duration of the backup, it prevents the transaction horizon from advancing until the backup finishes. On a large database with sufficiently high throughput, <code>pg_dump</code> may inadvertently trigger this phenomenon bringing the cluster into read-only mode.</p><iframe src="https://planetscale.com/blog/postgres-backups-under-the-hood/xid-wraparound/iframe" title="Interactive: a long-running pg_dump pins the freeze horizon until Postgres refuses to assign new XIDs" loading="lazy"></iframe><p>Above, we can see this in action. Each transaction has its own &quot;future&quot; and &quot;past&quot; based off its own <code>xid</code>. Every time <code>autovacuum</code> runs, it advances the oldest unfrozen <code>xid</code>. The blue section represents active <code>xid</code>s that have not yet been frozen.</p><p>When the cluster goes into read-only mode in our visual, new transactions would potentially cause data loss. A new transaction would see unfrozen tuples created by the first transaction after <code>pg_dump</code> ran as if they were created by a future transaction that has not yet run.</p><p>On very large clusters (upwards of 30TB), this is a valid concern depending on the write throughput to the database. This isn&#x27;t to say <code>pg_dump</code> is bad by any means. <code>pg_dump</code> is an extremely useful tool. The point here is demonstrating that for taking scheduled backups, <code>pg_dump</code> is most likely not the correct tool.</p><h2 id="file-system-backup"><a href="https://planetscale.com/blog/postgres-backups-under-the-hood#file-system-backup">File system backup</a></h2><p>Another approach is to perform a full file system backup. This is substantially faster than <code>pg_dump</code> for saving and restoring a backup.</p><p>A file system backup bypasses the database and directly copies the underlying file system.</p><p>In order for file system backups to be usable however, the database must be completely shut down. If the database is online during a backup, rows could be changed after the backup process has started, but before they have been copied, leaving the database in an inconsistent state.</p><div class="mb-3 border p-3 border-blue-600 dark:border-blue-500"><p><span class="bg-blue-600 px-sm text-white dark:bg-blue-500 dark:text-black">Note</span></p><p>It is possible to take a file system backup online, only if the underlying file system supports atomic file system snapshots. See the Postgres docs on <a href="https://www.postgresql.org/docs/current/backup-file.html">file system backups</a> for more details.</p></div><p>This is explained in more detail in the next section, as this is what continuous archiving solves.</p><iframe src="https://planetscale.com/blog/postgres-backups-under-the-hood/filesystem-backup/iframe" title="A file system backup requiring the database to be shut down while files are copied" loading="lazy"></iframe><p>The other drawback to this type of backup (and logical backups) is that changes to data after a backup has been taken are not included in the backup. If data from between &quot;now&quot; and the most recent backup needs to be recovered, it isn&#x27;t there.</p><p>The solution to this is to save the WAL, along with the file system, which is exactly what continuous archiving does.</p><p>Offline file system backups are generally a non-starter for production workloads, as no one wants to take down their database for hours to perform a daily backup.</p><h2 id="continuous-archiving"><a href="https://planetscale.com/blog/postgres-backups-under-the-hood#continuous-archiving">Continuous archiving</a></h2><p>The most powerful (and complicated) backup method is continuous archiving. Continuous archiving combines a file system backup with the write-ahead log (WAL).</p><p>This process can be done without downtime and generally lower impact on the CPU of the current system. This is what PlanetScale uses to facilitate Postgres and Neki backups.</p><p>The first step of taking a continuous archive backup has already started long before you take your first backup: archiving the WAL.</p><h3 id="the-wal"><a href="https://planetscale.com/blog/postgres-backups-under-the-hood#the-wal">The WAL</a></h3><p>The WAL is like your database&#x27;s logbook. Every change, addition, or deletion of the data in your database is written down in the WAL.</p><p>Before Postgres makes any changes to data on disk, it first records the changes in the WAL. This ensures that upon a system crash, Postgres can restore to a consistent state by replaying the data mutations saved in its WAL. See the <a href="https://en.wikipedia.org/wiki/Algorithms_for_Recovery_and_Isolation_Exploiting_Semantics">ARIES Wikipedia</a> for more information on the algorithm and reasons behind WAL.</p><p>The WAL is by default saved in 16MB segments as binary files, however the size is configurable per cluster. These can be fed to tools such as <code>pg_waldump</code> yielding human readable output:</p><div class="code-block" data-language="go"><div class="min-w-0 max-w-full"><pre class="shiki shiki-themes planetscale-light planetscale-dark" style="--shiki-light:#2b2b2b;--shiki-dark:#e1e1e1;--shiki-light-bg:#ebebeb;--shiki-dark-bg:#1a1a1a" tabindex="0"><code><span class="line"><span style="--shiki-light:#A78103;--shiki-dark:#F2B600">rmgr</span><span style="--shiki-light:#616161;--shiki-dark:#C1C1C1">:</span><span style="--shiki-light:#A78103;--shiki-dark:#F2B600"> Heap2</span><span style="--shiki-light:#A78103;--shiki-dark:#F2B600">       len</span><span style="--shiki-light:#616161;--shiki-dark:#C1C1C1"> (</span><span style="--shiki-light:#A78103;--shiki-dark:#F2B600">rec</span><span style="--shiki-light:#F35815;--shiki-dark:#F35815">/</span><span style="--shiki-light:#A78103;--shiki-dark:#F2B600">tot</span><span style="--shiki-light:#616161;--shiki-dark:#C1C1C1">):</span><span style="--shiki-light:#D92038;--shiki-dark:#FF7082">     60</span><span style="--shiki-light:#F35815;--shiki-dark:#F35815">/</span><span style="--shiki-light:#D92038;--shiki-dark:#FF7082">  7136</span><span style="--shiki-light:#616161;--shiki-dark:#C1C1C1">,</span><span style="--shiki-light:#A78103;--shiki-dark:#F2B600"> tx</span><span style="--shiki-light:#616161;--shiki-dark:#C1C1C1">:</span><span style="--shiki-light:#D92038;--shiki-dark:#FF7082">          0</span><span style="--shiki-light:#616161;--shiki-dark:#C1C1C1">,</span><span style="--shiki-light:#A78103;--shiki-dark:#F2B600"> lsn</span><span style="--shiki-light:#616161;--shiki-dark:#C1C1C1">:</span><span style="--shiki-light:#D92038;--shiki-dark:#FF7082"> 0</span><span style="--shiki-light:#F35815;--shiki-dark:#F35815">/</span><span style="--shiki-light:#C11027;--shiki-dark:#FF909F">01C12FF8</span><span style="--shiki-light:#616161;--shiki-dark:#C1C1C1">,</span><span style="--shiki-light:#A78103;--shiki-dark:#F2B600"> prev</span><span style="--shiki-light:#D92038;--shiki-dark:#FF7082"> 0</span><span style="--shiki-light:#F35815;--shiki-dark:#F35815">/</span><span style="--shiki-light:#C11027;--shiki-dark:#FF909F">01C12F80</span><span style="--shiki-light:#616161;--shiki-dark:#C1C1C1">,</span><span style="--shiki-light:#A78103;--shiki-dark:#F2B600"> desc</span><span style="--shiki-light:#616161;--shiki-dark:#C1C1C1">:</span><span style="--shiki-light:#A78103;--shiki-dark:#F2B600"> PRUNE</span><span style="--shiki-light:#A78103;--shiki-dark:#F2B600"> snapshotConflictHorizon</span><span style="--shiki-light:#616161;--shiki-dark:#C1C1C1">:</span><span style="--shiki-light:#D92038;--shiki-dark:#FF7082"> 771</span><span style="--shiki-light:#616161;--shiki-dark:#C1C1C1">,</span><span style="--shiki-light:#A78103;--shiki-dark:#F2B600"> nredirected</span><span style="--shiki-light:#616161;--shiki-dark:#C1C1C1">:</span><span style="--shiki-light:#D92038;--shiki-dark:#FF7082"> 0</span><span style="--shiki-light:#616161;--shiki-dark:#C1C1C1">,</span><span style="--shiki-light:#A78103;--shiki-dark:#F2B600"> ndead</span><span style="--shiki-light:#616161;--shiki-dark:#C1C1C1">:</span><span style="--shiki-light:#D92038;--shiki-dark:#FF7082"> 15</span></span>
<span class="line"><span style="--shiki-light:#A78103;--shiki-dark:#F2B600">	blkref</span><span style="--shiki-light:#2B2B2B;--shiki-dark:#E1E1E1"> #</span><span style="--shiki-light:#D92038;--shiki-dark:#FF7082">0</span><span style="--shiki-light:#616161;--shiki-dark:#C1C1C1">:</span><span style="--shiki-light:#A78103;--shiki-dark:#F2B600"> rel</span><span style="--shiki-light:#D92038;--shiki-dark:#FF7082"> 1663</span><span style="--shiki-light:#F35815;--shiki-dark:#F35815">/</span><span style="--shiki-light:#D92038;--shiki-dark:#FF7082">16384</span><span style="--shiki-light:#F35815;--shiki-dark:#F35815">/</span><span style="--shiki-light:#D92038;--shiki-dark:#FF7082">16387</span><span style="--shiki-light:#A78103;--shiki-dark:#F2B600"> fork</span><span style="--shiki-light:#A78103;--shiki-dark:#F2B600"> main</span><span style="--shiki-light:#A78103;--shiki-dark:#F2B600"> blk</span><span style="--shiki-light:#D92038;--shiki-dark:#FF7082"> 0</span><span style="--shiki-light:#616161;--shiki-dark:#C1C1C1"> (</span><span style="--shiki-light:#A78103;--shiki-dark:#F2B600">FPW</span><span style="--shiki-light:#616161;--shiki-dark:#C1C1C1">);</span><span style="--shiki-light:#A78103;--shiki-dark:#F2B600"> hole</span><span style="--shiki-light:#616161;--shiki-dark:#C1C1C1">:</span><span style="--shiki-light:#A78103;--shiki-dark:#F2B600"> offset</span><span style="--shiki-light:#616161;--shiki-dark:#C1C1C1">:</span><span style="--shiki-light:#D92038;--shiki-dark:#FF7082"> 452</span><span style="--shiki-light:#616161;--shiki-dark:#C1C1C1">,</span><span style="--shiki-light:#A78103;--shiki-dark:#F2B600"> length</span><span style="--shiki-light:#616161;--shiki-dark:#C1C1C1">:</span><span style="--shiki-light:#D92038;--shiki-dark:#FF7082"> 1116</span></span>
<span class="line"><span style="--shiki-light:#A78103;--shiki-dark:#F2B600">rmgr</span><span style="--shiki-light:#616161;--shiki-dark:#C1C1C1">:</span><span style="--shiki-light:#A78103;--shiki-dark:#F2B600"> Heap</span><span style="--shiki-light:#A78103;--shiki-dark:#F2B600">        len</span><span style="--shiki-light:#616161;--shiki-dark:#C1C1C1"> (</span><span style="--shiki-light:#A78103;--shiki-dark:#F2B600">rec</span><span style="--shiki-light:#F35815;--shiki-dark:#F35815">/</span><span style="--shiki-light:#A78103;--shiki-dark:#F2B600">tot</span><span style="--shiki-light:#616161;--shiki-dark:#C1C1C1">):</span><span style="--shiki-light:#D92038;--shiki-dark:#FF7082">    119</span><span style="--shiki-light:#F35815;--shiki-dark:#F35815">/</span><span style="--shiki-light:#D92038;--shiki-dark:#FF7082">  6443</span><span style="--shiki-light:#616161;--shiki-dark:#C1C1C1">,</span><span style="--shiki-light:#A78103;--shiki-dark:#F2B600"> tx</span><span style="--shiki-light:#616161;--shiki-dark:#C1C1C1">:</span><span style="--shiki-light:#D92038;--shiki-dark:#FF7082">        778</span><span style="--shiki-light:#616161;--shiki-dark:#C1C1C1">,</span><span style="--shiki-light:#A78103;--shiki-dark:#F2B600"> lsn</span><span style="--shiki-light:#616161;--shiki-dark:#C1C1C1">:</span><span style="--shiki-light:#D92038;--shiki-dark:#FF7082"> 0</span><span style="--shiki-light:#F35815;--shiki-dark:#F35815">/</span><span style="--shiki-light:#C11027;--shiki-dark:#FF909F">01C14BF0</span><span style="--shiki-light:#616161;--shiki-dark:#C1C1C1">,</span><span style="--shiki-light:#A78103;--shiki-dark:#F2B600"> prev</span><span style="--shiki-light:#D92038;--shiki-dark:#FF7082"> 0</span><span style="--shiki-light:#F35815;--shiki-dark:#F35815">/</span><span style="--shiki-light:#C11027;--shiki-dark:#FF909F">01C12FF8</span><span style="--shiki-light:#616161;--shiki-dark:#C1C1C1">,</span><span style="--shiki-light:#A78103;--shiki-dark:#F2B600"> desc</span><span style="--shiki-light:#616161;--shiki-dark:#C1C1C1">:</span><span style="--shiki-light:#A78103;--shiki-dark:#F2B600"> HOT_UPDATE</span><span style="--shiki-light:#A78103;--shiki-dark:#F2B600"> old_xmax</span><span style="--shiki-light:#616161;--shiki-dark:#C1C1C1">:</span><span style="--shiki-light:#D92038;--shiki-dark:#FF7082"> 778</span><span style="--shiki-light:#616161;--shiki-dark:#C1C1C1">,</span><span style="--shiki-light:#A78103;--shiki-dark:#F2B600"> old_off</span><span style="--shiki-light:#616161;--shiki-dark:#C1C1C1">:</span><span style="--shiki-light:#D92038;--shiki-dark:#FF7082"> 44</span><span style="--shiki-light:#616161;--shiki-dark:#C1C1C1">,</span><span style="--shiki-light:#A78103;--shiki-dark:#F2B600"> old_infobits</span><span style="--shiki-light:#616161;--shiki-dark:#C1C1C1">:</span><span style="--shiki-light:#616161;--shiki-dark:#C1C1C1"> [],</span><span style="--shiki-light:#A78103;--shiki-dark:#F2B600"> flags</span><span style="--shiki-light:#616161;--shiki-dark:#C1C1C1">:</span><span style="--shiki-light:#F35815;--shiki-dark:#F35815"> 0x</span><span style="--shiki-light:#D92038;--shiki-dark:#FF7082">10</span><span style="--shiki-light:#616161;--shiki-dark:#C1C1C1">,</span><span style="--shiki-light:#A78103;--shiki-dark:#F2B600"> new_xmax</span><span style="--shiki-light:#616161;--shiki-dark:#C1C1C1">:</span><span style="--shiki-light:#D92038;--shiki-dark:#FF7082"> 0</span><span style="--shiki-light:#616161;--shiki-dark:#C1C1C1">,</span><span style="--shiki-light:#A78103;--shiki-dark:#F2B600"> new_off</span><span style="--shiki-light:#616161;--shiki-dark:#C1C1C1">:</span><span style="--shiki-light:#D92038;--shiki-dark:#FF7082"> 85</span></span>
<span class="line"><span style="--shiki-light:#A78103;--shiki-dark:#F2B600">	blkref</span><span style="--shiki-light:#2B2B2B;--shiki-dark:#E1E1E1"> #</span><span style="--shiki-light:#D92038;--shiki-dark:#FF7082">0</span><span style="--shiki-light:#616161;--shiki-dark:#C1C1C1">:</span><span style="--shiki-light:#A78103;--shiki-dark:#F2B600"> rel</span><span style="--shiki-light:#D92038;--shiki-dark:#FF7082"> 1663</span><span style="--shiki-light:#F35815;--shiki-dark:#F35815">/</span><span style="--shiki-light:#D92038;--shiki-dark:#FF7082">16384</span><span style="--shiki-light:#F35815;--shiki-dark:#F35815">/</span><span style="--shiki-light:#D92038;--shiki-dark:#FF7082">16387</span><span style="--shiki-light:#A78103;--shiki-dark:#F2B600"> fork</span><span style="--shiki-light:#A78103;--shiki-dark:#F2B600"> main</span><span style="--shiki-light:#A78103;--shiki-dark:#F2B600"> blk</span><span style="--shiki-light:#D92038;--shiki-dark:#FF7082"> 1</span><span style="--shiki-light:#616161;--shiki-dark:#C1C1C1"> (</span><span style="--shiki-light:#A78103;--shiki-dark:#F2B600">FPW</span><span style="--shiki-light:#616161;--shiki-dark:#C1C1C1">);</span><span style="--shiki-light:#A78103;--shiki-dark:#F2B600"> hole</span><span style="--shiki-light:#616161;--shiki-dark:#C1C1C1">:</span><span style="--shiki-light:#A78103;--shiki-dark:#F2B600"> offset</span><span style="--shiki-light:#616161;--shiki-dark:#C1C1C1">:</span><span style="--shiki-light:#D92038;--shiki-dark:#FF7082"> 364</span><span style="--shiki-light:#616161;--shiki-dark:#C1C1C1">,</span><span style="--shiki-light:#A78103;--shiki-dark:#F2B600"> length</span><span style="--shiki-light:#616161;--shiki-dark:#C1C1C1">:</span><span style="--shiki-light:#D92038;--shiki-dark:#FF7082"> 1868</span></span>
<span class="line"><span style="--shiki-light:#A78103;--shiki-dark:#F2B600">rmgr</span><span style="--shiki-light:#616161;--shiki-dark:#C1C1C1">:</span><span style="--shiki-light:#A78103;--shiki-dark:#F2B600"> Heap</span><span style="--shiki-light:#A78103;--shiki-dark:#F2B600">        len</span><span style="--shiki-light:#616161;--shiki-dark:#C1C1C1"> (</span><span style="--shiki-light:#A78103;--shiki-dark:#F2B600">rec</span><span style="--shiki-light:#F35815;--shiki-dark:#F35815">/</span><span style="--shiki-light:#A78103;--shiki-dark:#F2B600">tot</span><span style="--shiki-light:#616161;--shiki-dark:#C1C1C1">):</span><span style="--shiki-light:#D92038;--shiki-dark:#FF7082">    114</span><span style="--shiki-light:#F35815;--shiki-dark:#F35815">/</span><span style="--shiki-light:#D92038;--shiki-dark:#FF7082">   114</span><span style="--shiki-light:#616161;--shiki-dark:#C1C1C1">,</span><span style="--shiki-light:#A78103;--shiki-dark:#F2B600"> tx</span><span style="--shiki-light:#616161;--shiki-dark:#C1C1C1">:</span><span style="--shiki-light:#D92038;--shiki-dark:#FF7082">        778</span><span style="--shiki-light:#616161;--shiki-dark:#C1C1C1">,</span><span style="--shiki-light:#A78103;--shiki-dark:#F2B600"> lsn</span><span style="--shiki-light:#616161;--shiki-dark:#C1C1C1">:</span><span style="--shiki-light:#D92038;--shiki-dark:#FF7082"> 0</span><span style="--shiki-light:#F35815;--shiki-dark:#F35815">/</span><span style="--shiki-light:#C11027;--shiki-dark:#FF909F">01C16538</span><span style="--shiki-light:#616161;--shiki-dark:#C1C1C1">,</span><span style="--shiki-light:#A78103;--shiki-dark:#F2B600"> prev</span><span style="--shiki-light:#D92038;--shiki-dark:#FF7082"> 0</span><span style="--shiki-light:#F35815;--shiki-dark:#F35815">/</span><span style="--shiki-light:#C11027;--shiki-dark:#FF909F">01C14BF0</span><span style="--shiki-light:#616161;--shiki-dark:#C1C1C1">,</span><span style="--shiki-light:#A78103;--shiki-dark:#F2B600"> desc</span><span style="--shiki-light:#616161;--shiki-dark:#C1C1C1">:</span><span style="--shiki-light:#A78103;--shiki-dark:#F2B600"> HOT_UPDATE</span><span style="--shiki-light:#A78103;--shiki-dark:#F2B600"> old_xmax</span><span style="--shiki-light:#616161;--shiki-dark:#C1C1C1">:</span><span style="--shiki-light:#D92038;--shiki-dark:#FF7082"> 778</span><span style="--shiki-light:#616161;--shiki-dark:#C1C1C1">,</span><span style="--shiki-light:#A78103;--shiki-dark:#F2B600"> old_off</span><span style="--shiki-light:#616161;--shiki-dark:#C1C1C1">:</span><span style="--shiki-light:#D92038;--shiki-dark:#FF7082"> 45</span><span style="--shiki-light:#616161;--shiki-dark:#C1C1C1">,</span><span style="--shiki-light:#A78103;--shiki-dark:#F2B600"> old_infobits</span><span style="--shiki-light:#616161;--shiki-dark:#C1C1C1">:</span><span style="--shiki-light:#616161;--shiki-dark:#C1C1C1"> [],</span><span style="--shiki-light:#A78103;--shiki-dark:#F2B600"> flags</span><span style="--shiki-light:#616161;--shiki-dark:#C1C1C1">:</span><span style="--shiki-light:#F35815;--shiki-dark:#F35815"> 0x</span><span style="--shiki-light:#D92038;--shiki-dark:#FF7082">10</span><span style="--shiki-light:#616161;--shiki-dark:#C1C1C1">,</span><span style="--shiki-light:#A78103;--shiki-dark:#F2B600"> new_xmax</span><span style="--shiki-light:#616161;--shiki-dark:#C1C1C1">:</span><span style="--shiki-light:#D92038;--shiki-dark:#FF7082"> 0</span><span style="--shiki-light:#616161;--shiki-dark:#C1C1C1">,</span><span style="--shiki-light:#A78103;--shiki-dark:#F2B600"> new_off</span><span style="--shiki-light:#616161;--shiki-dark:#C1C1C1">:</span><span style="--shiki-light:#D92038;--shiki-dark:#FF7082"> 86</span></span>
<span class="line"><span style="--shiki-light:#A78103;--shiki-dark:#F2B600">	blkref</span><span style="--shiki-light:#2B2B2B;--shiki-dark:#E1E1E1"> #</span><span style="--shiki-light:#D92038;--shiki-dark:#FF7082">0</span><span style="--shiki-light:#616161;--shiki-dark:#C1C1C1">:</span><span style="--shiki-light:#A78103;--shiki-dark:#F2B600"> rel</span><span style="--shiki-light:#D92038;--shiki-dark:#FF7082"> 1663</span><span style="--shiki-light:#F35815;--shiki-dark:#F35815">/</span><span style="--shiki-light:#D92038;--shiki-dark:#FF7082">16384</span><span style="--shiki-light:#F35815;--shiki-dark:#F35815">/</span><span style="--shiki-light:#D92038;--shiki-dark:#FF7082">16387</span><span style="--shiki-light:#A78103;--shiki-dark:#F2B600"> fork</span><span style="--shiki-light:#A78103;--shiki-dark:#F2B600"> main</span><span style="--shiki-light:#A78103;--shiki-dark:#F2B600"> blk</span><span style="--shiki-light:#D92038;--shiki-dark:#FF7082"> 1</span></span>
<span class="line"><span style="--shiki-light:#F35815;--shiki-dark:#F35815">...</span></span>
<span class="line"><span style="--shiki-light:#A78103;--shiki-dark:#F2B600">rmgr</span><span style="--shiki-light:#616161;--shiki-dark:#C1C1C1">:</span><span style="--shiki-light:#A78103;--shiki-dark:#F2B600"> Heap</span><span style="--shiki-light:#A78103;--shiki-dark:#F2B600">        len</span><span style="--shiki-light:#616161;--shiki-dark:#C1C1C1"> (</span><span style="--shiki-light:#A78103;--shiki-dark:#F2B600">rec</span><span style="--shiki-light:#F35815;--shiki-dark:#F35815">/</span><span style="--shiki-light:#A78103;--shiki-dark:#F2B600">tot</span><span style="--shiki-light:#616161;--shiki-dark:#C1C1C1">):</span><span style="--shiki-light:#D92038;--shiki-dark:#FF7082">    106</span><span style="--shiki-light:#F35815;--shiki-dark:#F35815">/</span><span style="--shiki-light:#D92038;--shiki-dark:#FF7082">   106</span><span style="--shiki-light:#616161;--shiki-dark:#C1C1C1">,</span><span style="--shiki-light:#A78103;--shiki-dark:#F2B600"> tx</span><span style="--shiki-light:#616161;--shiki-dark:#C1C1C1">:</span><span style="--shiki-light:#D92038;--shiki-dark:#FF7082">        778</span><span style="--shiki-light:#616161;--shiki-dark:#C1C1C1">,</span><span style="--shiki-light:#A78103;--shiki-dark:#F2B600"> lsn</span><span style="--shiki-light:#616161;--shiki-dark:#C1C1C1">:</span><span style="--shiki-light:#D92038;--shiki-dark:#FF7082"> 0</span><span style="--shiki-light:#F35815;--shiki-dark:#F35815">/</span><span style="--shiki-light:#C11027;--shiki-dark:#FF909F">01C16F78</span><span style="--shiki-light:#616161;--shiki-dark:#C1C1C1">,</span><span style="--shiki-light:#A78103;--shiki-dark:#F2B600"> prev</span><span style="--shiki-light:#D92038;--shiki-dark:#FF7082"> 0</span><span style="--shiki-light:#F35815;--shiki-dark:#F35815">/</span><span style="--shiki-light:#C11027;--shiki-dark:#FF909F">01C16F08</span><span style="--shiki-light:#616161;--shiki-dark:#C1C1C1">,</span><span style="--shiki-light:#A78103;--shiki-dark:#F2B600"> desc</span><span style="--shiki-light:#616161;--shiki-dark:#C1C1C1">:</span><span style="--shiki-light:#A78103;--shiki-dark:#F2B600"> HOT_UPDATE</span><span style="--shiki-light:#A78103;--shiki-dark:#F2B600"> old_xmax</span><span style="--shiki-light:#616161;--shiki-dark:#C1C1C1">:</span><span style="--shiki-light:#D92038;--shiki-dark:#FF7082"> 778</span><span style="--shiki-light:#616161;--shiki-dark:#C1C1C1">,</span><span style="--shiki-light:#A78103;--shiki-dark:#F2B600"> old_off</span><span style="--shiki-light:#616161;--shiki-dark:#C1C1C1">:</span><span style="--shiki-light:#D92038;--shiki-dark:#FF7082"> 82</span><span style="--shiki-light:#616161;--shiki-dark:#C1C1C1">,</span><span style="--shiki-light:#A78103;--shiki-dark:#F2B600"> old_infobits</span><span style="--shiki-light:#616161;--shiki-dark:#C1C1C1">:</span><span style="--shiki-light:#616161;--shiki-dark:#C1C1C1"> [],</span><span style="--shiki-light:#A78103;--shiki-dark:#F2B600"> flags</span><span style="--shiki-light:#616161;--shiki-dark:#C1C1C1">:</span><span style="--shiki-light:#F35815;--shiki-dark:#F35815"> 0x</span><span style="--shiki-light:#D92038;--shiki-dark:#FF7082">10</span><span style="--shiki-light:#616161;--shiki-dark:#C1C1C1">,</span><span style="--shiki-light:#A78103;--shiki-dark:#F2B600"> new_xmax</span><span style="--shiki-light:#616161;--shiki-dark:#C1C1C1">:</span><span style="--shiki-light:#D92038;--shiki-dark:#FF7082"> 0</span><span style="--shiki-light:#616161;--shiki-dark:#C1C1C1">,</span><span style="--shiki-light:#A78103;--shiki-dark:#F2B600"> new_off</span><span style="--shiki-light:#616161;--shiki-dark:#C1C1C1">:</span><span style="--shiki-light:#D92038;--shiki-dark:#FF7082"> 108</span></span>
<span class="line"><span style="--shiki-light:#A78103;--shiki-dark:#F2B600">	blkref</span><span style="--shiki-light:#2B2B2B;--shiki-dark:#E1E1E1"> #</span><span style="--shiki-light:#D92038;--shiki-dark:#FF7082">0</span><span style="--shiki-light:#616161;--shiki-dark:#C1C1C1">:</span><span style="--shiki-light:#A78103;--shiki-dark:#F2B600"> rel</span><span style="--shiki-light:#D92038;--shiki-dark:#FF7082"> 1663</span><span style="--shiki-light:#F35815;--shiki-dark:#F35815">/</span><span style="--shiki-light:#D92038;--shiki-dark:#FF7082">16384</span><span style="--shiki-light:#F35815;--shiki-dark:#F35815">/</span><span style="--shiki-light:#D92038;--shiki-dark:#FF7082">16387</span><span style="--shiki-light:#A78103;--shiki-dark:#F2B600"> fork</span><span style="--shiki-light:#A78103;--shiki-dark:#F2B600"> main</span><span style="--shiki-light:#A78103;--shiki-dark:#F2B600"> blk</span><span style="--shiki-light:#D92038;--shiki-dark:#FF7082"> 1</span></span>
<span class="line"><span style="--shiki-light:#A78103;--shiki-dark:#F2B600">rmgr</span><span style="--shiki-light:#616161;--shiki-dark:#C1C1C1">:</span><span style="--shiki-light:#A78103;--shiki-dark:#F2B600"> Transaction</span><span style="--shiki-light:#A78103;--shiki-dark:#F2B600"> len</span><span style="--shiki-light:#616161;--shiki-dark:#C1C1C1"> (</span><span style="--shiki-light:#A78103;--shiki-dark:#F2B600">rec</span><span style="--shiki-light:#F35815;--shiki-dark:#F35815">/</span><span style="--shiki-light:#A78103;--shiki-dark:#F2B600">tot</span><span style="--shiki-light:#616161;--shiki-dark:#C1C1C1">):</span><span style="--shiki-light:#D92038;--shiki-dark:#FF7082">     46</span><span style="--shiki-light:#F35815;--shiki-dark:#F35815">/</span><span style="--shiki-light:#D92038;--shiki-dark:#FF7082">    46</span><span style="--shiki-light:#616161;--shiki-dark:#C1C1C1">,</span><span style="--shiki-light:#A78103;--shiki-dark:#F2B600"> tx</span><span style="--shiki-light:#616161;--shiki-dark:#C1C1C1">:</span><span style="--shiki-light:#D92038;--shiki-dark:#FF7082">        778</span><span style="--shiki-light:#616161;--shiki-dark:#C1C1C1">,</span><span style="--shiki-light:#A78103;--shiki-dark:#F2B600"> lsn</span><span style="--shiki-light:#616161;--shiki-dark:#C1C1C1">:</span><span style="--shiki-light:#D92038;--shiki-dark:#FF7082"> 0</span><span style="--shiki-light:#F35815;--shiki-dark:#F35815">/</span><span style="--shiki-light:#C11027;--shiki-dark:#FF909F">01C16FE8</span><span style="--shiki-light:#616161;--shiki-dark:#C1C1C1">,</span><span style="--shiki-light:#A78103;--shiki-dark:#F2B600"> prev</span><span style="--shiki-light:#D92038;--shiki-dark:#FF7082"> 0</span><span style="--shiki-light:#F35815;--shiki-dark:#F35815">/</span><span style="--shiki-light:#C11027;--shiki-dark:#FF909F">01C16F78</span><span style="--shiki-light:#616161;--shiki-dark:#C1C1C1">,</span><span style="--shiki-light:#A78103;--shiki-dark:#F2B600"> desc</span><span style="--shiki-light:#616161;--shiki-dark:#C1C1C1">:</span><span style="--shiki-light:#A78103;--shiki-dark:#F2B600"> COMMIT</span><span style="--shiki-light:#D92038;--shiki-dark:#FF7082"> 2026</span><span style="--shiki-light:#F35815;--shiki-dark:#F35815">-</span><span style="--shiki-light:#D92038;--shiki-dark:#FF7082">07</span><span style="--shiki-light:#F35815;--shiki-dark:#F35815">-</span><span style="--shiki-light:#D92038;--shiki-dark:#FF7082">21</span><span style="--shiki-light:#D92038;--shiki-dark:#FF7082"> 02</span><span style="--shiki-light:#616161;--shiki-dark:#C1C1C1">:</span><span style="--shiki-light:#D92038;--shiki-dark:#FF7082">22</span><span style="--shiki-light:#616161;--shiki-dark:#C1C1C1">:</span><span style="--shiki-light:#D92038;--shiki-dark:#FF7082">15.866163</span><span style="--shiki-light:#A78103;--shiki-dark:#F2B600"> UTC</span></span>
<span class="line"><span style="--shiki-light:#A78103;--shiki-dark:#F2B600">rmgr</span><span style="--shiki-light:#616161;--shiki-dark:#C1C1C1">:</span><span style="--shiki-light:#A78103;--shiki-dark:#F2B600"> Heap</span><span style="--shiki-light:#A78103;--shiki-dark:#F2B600">        len</span><span style="--shiki-light:#616161;--shiki-dark:#C1C1C1"> (</span><span style="--shiki-light:#A78103;--shiki-dark:#F2B600">rec</span><span style="--shiki-light:#F35815;--shiki-dark:#F35815">/</span><span style="--shiki-light:#A78103;--shiki-dark:#F2B600">tot</span><span style="--shiki-light:#616161;--shiki-dark:#C1C1C1">):</span><span style="--shiki-light:#D92038;--shiki-dark:#FF7082">    107</span><span style="--shiki-light:#F35815;--shiki-dark:#F35815">/</span><span style="--shiki-light:#D92038;--shiki-dark:#FF7082">   807</span><span style="--shiki-light:#616161;--shiki-dark:#C1C1C1">,</span><span style="--shiki-light:#A78103;--shiki-dark:#F2B600"> tx</span><span style="--shiki-light:#616161;--shiki-dark:#C1C1C1">:</span><span style="--shiki-light:#D92038;--shiki-dark:#FF7082">        779</span><span style="--shiki-light:#616161;--shiki-dark:#C1C1C1">,</span><span style="--shiki-light:#A78103;--shiki-dark:#F2B600"> lsn</span><span style="--shiki-light:#616161;--shiki-dark:#C1C1C1">:</span><span style="--shiki-light:#D92038;--shiki-dark:#FF7082"> 0</span><span style="--shiki-light:#F35815;--shiki-dark:#F35815">/</span><span style="--shiki-light:#C11027;--shiki-dark:#FF909F">01C17018</span><span style="--shiki-light:#616161;--shiki-dark:#C1C1C1">,</span><span style="--shiki-light:#A78103;--shiki-dark:#F2B600"> prev</span><span style="--shiki-light:#D92038;--shiki-dark:#FF7082"> 0</span><span style="--shiki-light:#F35815;--shiki-dark:#F35815">/</span><span style="--shiki-light:#C11027;--shiki-dark:#FF909F">01C16FE8</span><span style="--shiki-light:#616161;--shiki-dark:#C1C1C1">,</span><span style="--shiki-light:#A78103;--shiki-dark:#F2B600"> desc</span><span style="--shiki-light:#616161;--shiki-dark:#C1C1C1">:</span><span style="--shiki-light:#A78103;--shiki-dark:#F2B600"> HOT_UPDATE</span><span style="--shiki-light:#A78103;--shiki-dark:#F2B600"> old_xmax</span><span style="--shiki-light:#616161;--shiki-dark:#C1C1C1">:</span><span style="--shiki-light:#D92038;--shiki-dark:#FF7082"> 779</span><span style="--shiki-light:#616161;--shiki-dark:#C1C1C1">,</span><span style="--shiki-light:#A78103;--shiki-dark:#F2B600"> old_off</span><span style="--shiki-light:#616161;--shiki-dark:#C1C1C1">:</span><span style="--shiki-light:#D92038;--shiki-dark:#FF7082"> 1</span><span style="--shiki-light:#616161;--shiki-dark:#C1C1C1">,</span><span style="--shiki-light:#A78103;--shiki-dark:#F2B600"> old_infobits</span><span style="--shiki-light:#616161;--shiki-dark:#C1C1C1">:</span><span style="--shiki-light:#616161;--shiki-dark:#C1C1C1"> [],</span><span style="--shiki-light:#A78103;--shiki-dark:#F2B600"> flags</span><span style="--shiki-light:#616161;--shiki-dark:#C1C1C1">:</span><span style="--shiki-light:#F35815;--shiki-dark:#F35815"> 0x</span><span style="--shiki-light:#D92038;--shiki-dark:#FF7082">10</span><span style="--shiki-light:#616161;--shiki-dark:#C1C1C1">,</span><span style="--shiki-light:#A78103;--shiki-dark:#F2B600"> new_xmax</span><span style="--shiki-light:#616161;--shiki-dark:#C1C1C1">:</span><span style="--shiki-light:#D92038;--shiki-dark:#FF7082"> 0</span><span style="--shiki-light:#616161;--shiki-dark:#C1C1C1">,</span><span style="--shiki-light:#A78103;--shiki-dark:#F2B600"> new_off</span><span style="--shiki-light:#616161;--shiki-dark:#C1C1C1">:</span><span style="--shiki-light:#D92038;--shiki-dark:#FF7082"> 2</span></span>
<span class="line"><span style="--shiki-light:#A78103;--shiki-dark:#F2B600">	blkref</span><span style="--shiki-light:#2B2B2B;--shiki-dark:#E1E1E1"> #</span><span style="--shiki-light:#D92038;--shiki-dark:#FF7082">0</span><span style="--shiki-light:#616161;--shiki-dark:#C1C1C1">:</span><span style="--shiki-light:#A78103;--shiki-dark:#F2B600"> rel</span><span style="--shiki-light:#D92038;--shiki-dark:#FF7082"> 1663</span><span style="--shiki-light:#F35815;--shiki-dark:#F35815">/</span><span style="--shiki-light:#D92038;--shiki-dark:#FF7082">16384</span><span style="--shiki-light:#F35815;--shiki-dark:#F35815">/</span><span style="--shiki-light:#D92038;--shiki-dark:#FF7082">16399</span><span style="--shiki-light:#A78103;--shiki-dark:#F2B600"> fork</span><span style="--shiki-light:#A78103;--shiki-dark:#F2B600"> main</span><span style="--shiki-light:#A78103;--shiki-dark:#F2B600"> blk</span><span style="--shiki-light:#D92038;--shiki-dark:#FF7082"> 0</span><span style="--shiki-light:#616161;--shiki-dark:#C1C1C1"> (</span><span style="--shiki-light:#A78103;--shiki-dark:#F2B600">FPW</span><span style="--shiki-light:#616161;--shiki-dark:#C1C1C1">);</span><span style="--shiki-light:#A78103;--shiki-dark:#F2B600"> hole</span><span style="--shiki-light:#616161;--shiki-dark:#C1C1C1">:</span><span style="--shiki-light:#A78103;--shiki-dark:#F2B600"> offset</span><span style="--shiki-light:#616161;--shiki-dark:#C1C1C1">:</span><span style="--shiki-light:#D92038;--shiki-dark:#FF7082"> 508</span><span style="--shiki-light:#616161;--shiki-dark:#C1C1C1">,</span><span style="--shiki-light:#A78103;--shiki-dark:#F2B600"> length</span><span style="--shiki-light:#616161;--shiki-dark:#C1C1C1">:</span><span style="--shiki-light:#D92038;--shiki-dark:#FF7082"> 7492</span></span>
<span class="line"><span style="--shiki-light:#A78103;--shiki-dark:#F2B600">rmgr</span><span style="--shiki-light:#616161;--shiki-dark:#C1C1C1">:</span><span style="--shiki-light:#A78103;--shiki-dark:#F2B600"> Heap</span><span style="--shiki-light:#A78103;--shiki-dark:#F2B600">        len</span><span style="--shiki-light:#616161;--shiki-dark:#C1C1C1"> (</span><span style="--shiki-light:#A78103;--shiki-dark:#F2B600">rec</span><span style="--shiki-light:#F35815;--shiki-dark:#F35815">/</span><span style="--shiki-light:#A78103;--shiki-dark:#F2B600">tot</span><span style="--shiki-light:#616161;--shiki-dark:#C1C1C1">):</span><span style="--shiki-light:#D92038;--shiki-dark:#FF7082">    107</span><span style="--shiki-light:#F35815;--shiki-dark:#F35815">/</span><span style="--shiki-light:#D92038;--shiki-dark:#FF7082">   911</span><span style="--shiki-light:#616161;--shiki-dark:#C1C1C1">,</span><span style="--shiki-light:#A78103;--shiki-dark:#F2B600"> tx</span><span style="--shiki-light:#616161;--shiki-dark:#C1C1C1">:</span><span style="--shiki-light:#D92038;--shiki-dark:#FF7082">        779</span><span style="--shiki-light:#616161;--shiki-dark:#C1C1C1">,</span><span style="--shiki-light:#A78103;--shiki-dark:#F2B600"> lsn</span><span style="--shiki-light:#616161;--shiki-dark:#C1C1C1">:</span><span style="--shiki-light:#D92038;--shiki-dark:#FF7082"> 0</span><span style="--shiki-light:#F35815;--shiki-dark:#F35815">/</span><span style="--shiki-light:#C11027;--shiki-dark:#FF909F">01C17340</span><span style="--shiki-light:#616161;--shiki-dark:#C1C1C1">,</span><span style="--shiki-light:#A78103;--shiki-dark:#F2B600"> prev</span><span style="--shiki-light:#D92038;--shiki-dark:#FF7082"> 0</span><span style="--shiki-light:#F35815;--shiki-dark:#F35815">/</span><span style="--shiki-light:#C11027;--shiki-dark:#FF909F">01C17018</span><span style="--shiki-light:#616161;--shiki-dark:#C1C1C1">,</span><span style="--shiki-light:#A78103;--shiki-dark:#F2B600"> desc</span><span style="--shiki-light:#616161;--shiki-dark:#C1C1C1">:</span><span style="--shiki-light:#A78103;--shiki-dark:#F2B600"> HOT_UPDATE</span><span style="--shiki-light:#A78103;--shiki-dark:#F2B600"> old_xmax</span><span style="--shiki-light:#616161;--shiki-dark:#C1C1C1">:</span><span style="--shiki-light:#D92038;--shiki-dark:#FF7082"> 779</span><span style="--shiki-light:#616161;--shiki-dark:#C1C1C1">,</span><span style="--shiki-light:#A78103;--shiki-dark:#F2B600"> old_off</span><span style="--shiki-light:#616161;--shiki-dark:#C1C1C1">:</span><span style="--shiki-light:#D92038;--shiki-dark:#FF7082"> 2</span><span style="--shiki-light:#616161;--shiki-dark:#C1C1C1">,</span><span style="--shiki-light:#A78103;--shiki-dark:#F2B600"> old_infobits</span><span style="--shiki-light:#616161;--shiki-dark:#C1C1C1">:</span><span style="--shiki-light:#616161;--shiki-dark:#C1C1C1"> [],</span><span style="--shiki-light:#A78103;--shiki-dark:#F2B600"> flags</span><span style="--shiki-light:#616161;--shiki-dark:#C1C1C1">:</span><span style="--shiki-light:#F35815;--shiki-dark:#F35815"> 0x</span><span style="--shiki-light:#D92038;--shiki-dark:#FF7082">10</span><span style="--shiki-light:#616161;--shiki-dark:#C1C1C1">,</span><span style="--shiki-light:#A78103;--shiki-dark:#F2B600"> new_xmax</span><span style="--shiki-light:#616161;--shiki-dark:#C1C1C1">:</span><span style="--shiki-light:#D92038;--shiki-dark:#FF7082"> 0</span><span style="--shiki-light:#616161;--shiki-dark:#C1C1C1">,</span><span style="--shiki-light:#A78103;--shiki-dark:#F2B600"> new_off</span><span style="--shiki-light:#616161;--shiki-dark:#C1C1C1">:</span><span style="--shiki-light:#D92038;--shiki-dark:#FF7082"> 3</span></span>
<span class="line"><span style="--shiki-light:#A78103;--shiki-dark:#F2B600">	blkref</span><span style="--shiki-light:#2B2B2B;--shiki-dark:#E1E1E1"> #</span><span style="--shiki-light:#D92038;--shiki-dark:#FF7082">0</span><span style="--shiki-light:#616161;--shiki-dark:#C1C1C1">:</span><span style="--shiki-light:#A78103;--shiki-dark:#F2B600"> rel</span><span style="--shiki-light:#D92038;--shiki-dark:#FF7082"> 1663</span><span style="--shiki-light:#F35815;--shiki-dark:#F35815">/</span><span style="--shiki-light:#D92038;--shiki-dark:#FF7082">16384</span><span style="--shiki-light:#F35815;--shiki-dark:#F35815">/</span><span style="--shiki-light:#D92038;--shiki-dark:#FF7082">16399</span><span style="--shiki-light:#A78103;--shiki-dark:#F2B600"> fork</span><span style="--shiki-light:#A78103;--shiki-dark:#F2B600"> main</span><span style="--shiki-light:#A78103;--shiki-dark:#F2B600"> blk</span><span style="--shiki-light:#D92038;--shiki-dark:#FF7082"> 8</span><span style="--shiki-light:#616161;--shiki-dark:#C1C1C1"> (</span><span style="--shiki-light:#A78103;--shiki-dark:#F2B600">FPW</span><span style="--shiki-light:#616161;--shiki-dark:#C1C1C1">);</span><span style="--shiki-light:#A78103;--shiki-dark:#F2B600"> hole</span><span style="--shiki-light:#616161;--shiki-dark:#C1C1C1">:</span><span style="--shiki-light:#A78103;--shiki-dark:#F2B600"> offset</span><span style="--shiki-light:#616161;--shiki-dark:#C1C1C1">:</span><span style="--shiki-light:#D92038;--shiki-dark:#FF7082"> 500</span><span style="--shiki-light:#616161;--shiki-dark:#C1C1C1">,</span><span style="--shiki-light:#A78103;--shiki-dark:#F2B600"> length</span><span style="--shiki-light:#616161;--shiki-dark:#C1C1C1">:</span><span style="--shiki-light:#D92038;--shiki-dark:#FF7082"> 7388</span></span>
<span class="line"></span></code></pre></div></div><p>There is a lot of information here, and remember this is only what <code>pg_waldump</code> is showing us. For understanding how continuous archiving works, there are a few parts of WAL we need to understand.</p><ul><li><code>len (rec/tot)</code>: <code>rec</code> is the size in bytes of the specific record data, while <code>tot</code> is the total bytes saved in WAL for this entry.</li><li><code>lsn</code>: The log sequence number (LSN) is the byte address of the given WAL line.</li><li><code>FPW</code>: Full page write (FPW) marks where a full page was written to the WAL. This is what causes rec != tot in the <code>len</code> field.</li><li><code>rel</code>: Tablespace / db / filenode, or more simply put, the location of a table file in a specific database. Tables are represented as filenodes, which are made up of pages, and saved as files on disk. See our <a href="https://planetscale.com/blog/postgresql-mvcc">MVCC blog</a> for more detail.</li><li><code>blk</code>: The specific page of the filenode that is being updated or saved.</li><li><code>desc</code>: What action is happening. <code>HOT_UPDATE</code>, for example, is when an updated tuple with an associated index (in this case from an <code>UPDATE</code> SQL query) is saved to the same page it was originally on.</li></ul><p>By default, Postgres enables a setting called <code>full_page_writes</code>. This setting is necessary for continuous archiving, and is forced on during a file system backup (also known as a base backup). This instructs Postgres to save an entire page to WAL the first time the page is updated after a checkpoint.</p><p>If the base backup is taken from a replica or standby node, then the operator must ensure <code>full_page_writes</code> is turned on for the primary. When the backup is taken directly on the primary, <code>pg_basebackup</code> (the common CLI tool for taking continuous archives) will force it on.</p><div class="mb-3 border p-3 border-blue-600 dark:border-blue-500"><p><span class="bg-blue-600 px-sm text-white dark:bg-blue-500 dark:text-black">Note</span></p><p>Pages are chunks of data within table or index files on disk, usually 8KB per page. Pages contain the underlying tuples and pointers that materialize into rows.</p></div><p>Every WAL line above containing <code>FPW</code> marks a point where Postgres saved the entire page (<code>blk</code>) within a given filenode (<code>rel</code>) to the WAL.</p><p>If you look closely at the <code>rel</code>, <code>blk</code>, and <code>FPW</code> on each line, you can see each first update to a given page (<code>rel</code>/<code>blk</code>) after a checkpoint triggers a new full page write. This is the mechanism that makes continuous archiving possible, as we will see later on.</p><h3 id="archiving-data"><a href="https://planetscale.com/blog/postgres-backups-under-the-hood#archiving-data">Archiving data</a></h3><p>Saving WAL segments often means streaming them to external storage systems such as S3. This can be done via tools such as <code>wal-g</code>, which are built for this exact purpose.</p><p>For any Postgres cluster (including <a href="https://planetscale.com/neki">Neki</a> shards) running on PlanetScale, every primary has a <code>wal-g</code> sidecar streaming its Postgres WAL to S3.</p><p>When we start a backup, we begin by taking an online file system backup. Interestingly, we don&#x27;t care if writes or mutations cause the file system to be in an inconsistent state, or even corrupted.</p><p>The data files we copy over can be thought of as &quot;smeared&quot; data on disk since they have potentially been &quot;smeared&quot; by queries that happened during our backup. We will take a look at exactly why we don&#x27;t need to worry about smeared data with an example.</p><p>The start time is based on a LSN in the log, known as the backup&#x27;s <code>start_lsn</code>, while the <code>end_lsn</code> is the point in the WAL at which the backup completed.</p><iframe src="https://planetscale.com/blog/postgres-backups-under-the-hood/continuous-archive/iframe" title="Continuous archiving: data files copied to S3 while WAL is continuously archived" loading="lazy"></iframe><p>Say we start taking a backup at some time stamp. As the backup is copying over files, the database receives a SQL statement:</p><div class="code-block" data-language="sql"><div class="min-w-0 max-w-full"><pre class="shiki shiki-themes planetscale-light planetscale-dark" style="--shiki-light:#2b2b2b;--shiki-dark:#e1e1e1;--shiki-light-bg:#ebebeb;--shiki-dark-bg:#1a1a1a" tabindex="0"><code><span class="line"><span style="--shiki-light:#F35815;--shiki-dark:#F35815">UPDATE</span><span style="--shiki-light:#2B2B2B;--shiki-dark:#E1E1E1"> users </span><span style="--shiki-light:#F35815;--shiki-dark:#F35815">SET</span><span style="--shiki-light:#2B2B2B;--shiki-dark:#E1E1E1"> email_confirmed</span><span style="--shiki-light:#F35815;--shiki-dark:#F35815">=</span><span style="--shiki-light:#2B2B2B;--shiki-dark:#E1E1E1">true </span><span style="--shiki-light:#F35815;--shiki-dark:#F35815">WHERE</span><span style="--shiki-light:#2B2B2B;--shiki-dark:#E1E1E1"> id </span><span style="--shiki-light:#F35815;--shiki-dark:#F35815">=</span><span style="--shiki-light:#D92038;--shiki-dark:#FF7082"> 314159</span></span>
<span class="line"></span></code></pre></div></div><p>where <code>email_confirmed</code> was previously false. At this point, any one of three things could happen after the query executes.</p><ol><li>The backup process has already copied the file containing the page for that row where <code>email_confirmed</code> was set to false. This is the best case; our backup is unaffected, and still in a consistent state. We have already copied the file, so we do not care if it is modified after the fact.</li><li>The backup has not yet read the page where that row lives, and our backup is now out of sync. The backup started at a time where <code>email_confirmed</code> was false, but it will save that data page while it is true!</li><li>The page is backed up at the same instant it was written to, and is now corrupted. The page now contains mangled bits, and later on we will be unable to read its contents properly.</li></ol><iframe src="https://planetscale.com/blog/postgres-backups-under-the-hood/update-scenarios/iframe" title="Three possible outcomes of an UPDATE landing during an online file system copy" loading="lazy"></iframe><p>How does Postgres know how to un-smear these data files?</p><p>This is where the <code>full_page_writes</code> capability of the WAL comes into play. After we have copied over the smeared file system backup from S3 to a new container for restoring, Postgres looks over the WAL reading every change between <code>start_lsn</code> and <code>end_lsn</code>.</p><p>Since <code>full_page_writes</code> was on when Postgres received the <code>UPDATE users ...</code> query mentioned above, it created a new heap tuple on disk as usual, and additionally logged a full image of the entire 8KB page where that row lives to the WAL.</p><p>Regardless of the state of that page from the file system backup, whether it is corrupted, in an inconsistent state, or perfectly healthy, we have enough information within the WAL to reconstruct it. The full page image in the WAL can replace the same page that was originally backed up if the ordinary WAL records are not enough to repair it.</p><iframe src="https://planetscale.com/blog/postgres-backups-under-the-hood/wal-page-fix/iframe" title="WAL replay healing smeared pages with full-page images" loading="lazy"></iframe><p>Notice that the actual restored backup is not a snapshot of the database when the backup was started (like how <code>pg_dump</code> works), but a consistent version of the database when it finished backing up.</p><p>If we tried to restore the database to a point in-between <code>start_lsn</code> and <code>end_lsn</code> we would potentially be left with smeared data. The restore process must read through the full WAL from start to end before the restore can be marked as healthy.</p><h3 id="point-in-time-recovery"><a href="https://planetscale.com/blog/postgres-backups-under-the-hood#point-in-time-recovery">Point in time recovery</a></h3><p>The backups system described above is also what facilitates Postgres&#x27; ability to do point-in-time restores.</p><p>This is where the &quot;Continuous&quot; part of &quot;Continuous Archiving&quot; comes into play. Since the WAL is continuously saved to S3, we can restore any backup and continuously replay the WAL past our <code>end_lsn</code> up to any arbitrary point in time.</p><p>Replaying the WAL is generally more expensive than copying over the file system, however. This is why backups need to happen often, and is why at PlanetScale we back up every cluster every 12 hours by default. This keeps the WAL replay within a reasonable bound (half of a day) and keeps restores fast.</p><p>Continuously saving WAL is what also powers cluster resizes. When you resize your cluster on PlanetScale, the following is happening under the hood:</p><ol><li>We bring up a new node with the desired specs</li><li>Copy over the file system backup (or mount an EBS volume if we are on an EBS backed node)</li><li>Replay WAL as close to the current time as possible</li><li>Stream remaining changes from the primary</li><li>Cutover to new node</li></ol><iframe src="https://planetscale.com/blog/postgres-backups-under-the-hood/cluster-resize/iframe" title="A cluster resize: the new node restores the latest backup, replays WAL, then takes over traffic" loading="lazy"></iframe><p>In fact, this is the same process we use to take backups in the first place! We use the latest backup taken (usually around 12 hours ago), bring it online, catch it up to the primary, and finally save its file system as a new backup. This is all done on a throwaway node only used to take a new backup, meaning the entire process never contends with the primary for CPU, IO, or network bandwidth.</p><h2 id="backups-at-scale"><a href="https://planetscale.com/blog/postgres-backups-under-the-hood#backups-at-scale">Backups at scale</a></h2><p>Even with these techniques in place, extremely large databases can end up with backups that take 12+ hours to complete, resulting in ever growing windows between restore points.</p><p>When restore is needed, it could take days to get the new node back online. You can attempt a PITR from your most recent backup, but that could mean waiting substantially longer for WAL to not only stream over, but replay onto a new node.</p><p>We <a href="https://planetscale.com/blog/faster-backups-with-sharding">wrote previously</a> on how Vitess handles backups at this scale, but what about Postgres?</p><p>Find out next week where we discuss distributed Postgres, and how splitting your cluster into shards with <a href="https://neki.dev/">Neki</a> can scale your backup process to petabytes and beyond.</p>]]></content>
    <summary><![CDATA[With backups being such a vital part of keeping your data safe, how do they actually work?]]></summary>
  </entry>
  <entry>
    <title>Making 768 servers look like 1</title>
    <link href="https://planetscale.com/blog/making-768-servers-look-like-1"/>
    <id>https://planetscale.com/blog/making-768-servers-look-like-1</id>
    <published>2026-07-15T00:00:00.000Z</published>
    <updated>2026-07-15T00:00:00.000Z</updated>
    <author>
      <name>Ben Dicken</name>
    </author>
    <category term="engineering"/>
    <content type="html"><![CDATA[<iframe src="https://planetscale.com/blog/many-servers-appear-as-one/iframe#servers" title="/blog/many-servers-appear-as-one/iframe#servers" loading="lazy"></iframe><p>This is 768 servers.</p><p>To some, that looks like a lot of computers. To those managing the infrastructure for apps with millions of customers, executing millions of queries per second, pretty normal. Products at this scale frequently require thousands of servers working in unison.</p><p>The most difficult infrastructure component to scale is almost always the database. A single database server cannot handle such demand, so we must spread the queries and data out across many servers with <span class="bg-blue-100/80 text-blue-700 dark:bg-blue-800/80 dark:text-blue-300">database sharding</span>.</p><p>Database sharding is the best way to scale a Postgres or MySQL database for anything beyond a few terabytes of data. Let&#x27;s look at how we go from a small single-node database, to one with a few terabytes spread across four shards, all the way up to one that is sharded across 768 servers and storing a petabyte of data.</p><h2 id="growing-pains"><a href="https://planetscale.com/blog/making-768-servers-look-like-1#growing-pains">Growing pains</a></h2><p>To understand why sharding is a necessary part of scaling relational databases, we must understand the bottlenecks of less scalable approaches.</p><p>Consider first a simple application architecture.</p><iframe src="https://planetscale.com/blog/many-servers-appear-as-one/iframe#popular-arch" title="/blog/many-servers-appear-as-one/iframe#popular-arch" loading="lazy"></iframe><p>Most applications you&#x27;ve ever used function in this way, or at least did early in their existence. The software running on a client device connects to an app server over the internet. This app server lives in a data center and handles authentication, page loads, and all the server-side logic for how your application behaves. All the persisted data like user accounts, posts, settings, and messages get stored in and retrieved from the database server (where &quot;database server&quot; is typically Postgres or MySQL, though the focus of this article is Postgres).</p><p>Even with a large database servers (10s of CPU cores, 100s of gigabytes of RAM) bottlenecks arise pretty quickly. Typically, it is either CPU constraints due to high query volume, or I/O constraints (IOPS) due to a high volume of reads and writes.</p><p>This is summed up nicely by the Universal Scalability Law:</p><iframe src="https://planetscale.com/blog/many-servers-appear-as-one/iframe#universal-scalability-law" title="/blog/many-servers-appear-as-one/iframe#universal-scalability-law" loading="lazy"></iframe><p>In short, the USL states that resource <em>contention</em> causes scalability to grow sub-linearly with increasing resources, and at a certain point, <em>incoherence</em> causes performance degradation. This is true for Postgres, as with any software system attempting to scale out across many threads or processes on a larger server.</p><p>One way to solve this, at least in the short term, is leveraging read-replicas.</p><iframe src="https://planetscale.com/blog/many-servers-appear-as-one/iframe#primary-replicas" title="/blog/many-servers-appear-as-one/iframe#primary-replicas" loading="lazy"></iframe><p>In this configuration, you maintain the original server as a <em>primary</em> and add additional <em>replicas</em> as shown above.</p><p>The primary sends a continuous stream of messages to every replica to ensure they stay up-to-date with the data changes on the primary. Writes (<code>INSERT</code>, <code>UPDATE</code>, <code>DELETE</code>) can only go to the primary. If writes were allowed to any server, we could end up with conflicting data. Solving this requires complex and slow consensus algorithms, which is possible, but in most cases not ideal for optimal performance.</p><p>However, app servers can send read (<code>SELECT</code>) queries to the replicas. Since most apps have a much higher percent of reads compared to writes, this provides a lot more scalability. (Replicas are also necessary for high availability and data durability, even if query traffic does not require them).</p><p>The database can scale to handle more traffic by adding replicas. An extreme example of this is <a href="https://openai.com/index/scaling-postgresql/">OpenAI&#x27;s use of 50 replicas on a single Primary</a>.</p><p>It turns out, scaling servers vertically (increasing CPU / RAM) and adding replicas can only take you so far. There are several bottlenecks that cannot be solved in this way</p><h3 id="1-writes-limited-to-one-server"><a href="https://planetscale.com/blog/making-768-servers-look-like-1#1-writes-limited-to-one-server">1) Writes limited to one server</a></h3><p>With high enough write volume, no amount of additional read-only replicas will alleviate an issue. Before Postgres can acknowledge a committed write, it must record the change in its write-ahead log (WAL) and flush that log to durable storage. The WAL is a shared resource amongst all connections on the primary. This is essentially a single write bottleneck across your entire database, even if you have tens of replicas.</p><h3 id="2-replicas-do-not-increase-data-capacity"><a href="https://planetscale.com/blog/making-768-servers-look-like-1#2-replicas-do-not-increase-data-capacity">2) Replicas do not increase data capacity</a></h3><p>A replica is a full copy of the primary&#x27;s data, including all indexes. Adding replicas gives us more places to run reads, but it does not distribute the data.</p><h3 id="3-backups"><a href="https://planetscale.com/blog/making-768-servers-look-like-1#3-backups">3) Backups</a></h3><p>Backups are an important part of data durability and RPO / RTO guarantees. Taking a backup of a large, monolithic database to object storage can take hours or even days due to the bandwidth limitations of node-to-storage communication. This is unacceptably long for many organizations that rely on frequent and validated backups.</p><p>The most proven way to handle this is sharding.</p><h2 id="sharding-with-a-d"><a href="https://planetscale.com/blog/making-768-servers-look-like-1#sharding-with-a-d">Sharding, with a &quot;d&quot;</a></h2><p>Sharding solves these three bottlenecks by distributing the data and queries across many distinct primaries. For data, it is useful because a single node can only store so much and is limited on write throughput. For queries, this is useful because the network interconnects and CPUs can only process so many queries at a time.</p><iframe src="https://planetscale.com/blog/many-servers-appear-as-one/iframe#sharding" title="/blog/many-servers-appear-as-one/iframe#sharding" loading="lazy"></iframe><p>Sharding is useful at all scales past a few terabytes of data. For example, with 2 terabytes of data, we may choose a setup with four shards, each storing 500 gigabytes and handling 1/4th of the total query traffic. When we needed to store a petabyte of data (one million gigabytes), we&#x27;d need many more shards. In this case, we can use 256 shards, each with a primary + 2 replicas, and each responsible for storing ~4 terabytes. This requires 256 * 3 = 768 servers!</p><p>Without a good system in place, this adds significant complexity to our app&#x27;s backend. With so much going on, how does the system...</p><ul><li>Decide which data goes to which server?</li><li>Decide which queries go to which server?</li><li>Handle queries that need to talk to multiple shards simultaneously?</li><li>Take backups across this spread-out database?</li><li>Monitor system-wide health?</li><li>Respond to a failing server?</li></ul><p>There&#x27;s a lot that could be said in addressing each one of those concerns. But the question to address here in this article is the following:</p><p><span class="bg-blue-100/80 text-blue-700 dark:bg-blue-800/80 dark:text-blue-300">How can these 768 servers look like 1 cohesive database to our apps?</span></p><p>We want to allow the application servers to go from interacting with a complex system, like this:</p><iframe src="https://planetscale.com/blog/many-servers-appear-as-one/iframe#tons-of-shards" title="/blog/many-servers-appear-as-one/iframe#tons-of-shards" loading="lazy"></iframe><p>To instead interacting with it over a single connection string, making it appear as if it&#x27;s interfacing with one large, scalable database:</p><iframe src="https://planetscale.com/blog/many-servers-appear-as-one/iframe#simple-sharded" title="/blog/many-servers-appear-as-one/iframe#simple-sharded" loading="lazy"></iframe><p>While in reality, utilizing tens or hundreds of shards. <a href="https://neki.dev/">Neki</a> for Postgres and <a href="https://vitess.io/">Vitess</a> for MySQL solve this. Let&#x27;s see how.</p><h2 id="the-proxy-layer"><a href="https://planetscale.com/blog/making-768-servers-look-like-1#the-proxy-layer">The proxy layer</a></h2><p>The most important amongst several critical pieces here is the proxy layer.</p><p>Proxies are middleware servers that sit between two services. In our case, these two services are the application servers and database servers.</p><p>Proxies are frequently used with Postgres databases. Even when there&#x27;s no sharding, they are useful for connection pooling and request queuing. For regular (unsharded) Postgres, PgBouncer is a popular proxy that people use to multiplex 1000s of app connections across fewer direct Postgres connections.</p><iframe src="https://planetscale.com/blog/many-servers-appear-as-one/iframe#pgbouncer" title="/blog/many-servers-appear-as-one/iframe#pgbouncer" loading="lazy"></iframe><p>PgBouncer has a simple goal. It&#x27;s built to accept a large number of connections from many clients and route them through a smaller pool of connections that it continually maintains with Postgres. The query queuing is useful for traffic surges and during database failover, so requests can resume when the new primary comes online. We have a whole <a href="https://planetscale.com/blog/scaling-postgres-connections-with-pgbouncer">blog on PgBouncer</a> if you want to learn more.</p><p>Sharding Postgres requires an even more sophisticated proxy. The biggest difference is that, in addition to multiplexing and buffering, the proxy must understand how data is distributed across servers and route SQL queries to the correct shards. Because of this, we refer to it as a <em>router</em>.</p><p>When inserting data, the router must be aware of how data is to be distributed. This is known as the <a href="https://planetscale.com/blog/database-sharding#sharding-strategy">sharding strategy</a>.</p><p>A common approach is to shard incoming rows based on a hash of an id column. When inserting row like this into the database:</p><div class="code-block" data-language="SQL"><div class="min-w-0 max-w-full"><pre class="shiki shiki-themes planetscale-light planetscale-dark" style="--shiki-light:#2b2b2b;--shiki-dark:#e1e1e1;--shiki-light-bg:#ebebeb;--shiki-dark-bg:#1a1a1a" tabindex="0"><code><span class="line"><span style="--shiki-light:#F35815;--shiki-dark:#F35815"> INSERT INTO</span><span style="--shiki-light:#2B2B2B;--shiki-dark:#E1E1E1"> users (id, username, email) </span><span style="--shiki-light:#F35815;--shiki-dark:#F35815">VALUES</span></span>
<span class="line"><span style="--shiki-light:#2B2B2B;--shiki-dark:#E1E1E1">    (</span><span style="--shiki-light:#D92038;--shiki-dark:#FF7082">1</span><span style="--shiki-light:#2B2B2B;--shiki-dark:#E1E1E1">, </span><span style="--shiki-light:#13862E;--shiki-dark:#75DB8C">'ada'</span><span style="--shiki-light:#2B2B2B;--shiki-dark:#E1E1E1">, </span><span style="--shiki-light:#13862E;--shiki-dark:#75DB8C">'ada@example.com'</span><span style="--shiki-light:#2B2B2B;--shiki-dark:#E1E1E1">),</span></span>
<span class="line"><span style="--shiki-light:#2B2B2B;--shiki-dark:#E1E1E1">    (</span><span style="--shiki-light:#D92038;--shiki-dark:#FF7082">2</span><span style="--shiki-light:#2B2B2B;--shiki-dark:#E1E1E1">, </span><span style="--shiki-light:#13862E;--shiki-dark:#75DB8C">'grace'</span><span style="--shiki-light:#2B2B2B;--shiki-dark:#E1E1E1">, </span><span style="--shiki-light:#13862E;--shiki-dark:#75DB8C">'grace@example.com'</span><span style="--shiki-light:#2B2B2B;--shiki-dark:#E1E1E1">),</span></span>
<span class="line"><span style="--shiki-light:#2B2B2B;--shiki-dark:#E1E1E1">    (</span><span style="--shiki-light:#D92038;--shiki-dark:#FF7082">3</span><span style="--shiki-light:#2B2B2B;--shiki-dark:#E1E1E1">, </span><span style="--shiki-light:#13862E;--shiki-dark:#75DB8C">'linus'</span><span style="--shiki-light:#2B2B2B;--shiki-dark:#E1E1E1">, </span><span style="--shiki-light:#13862E;--shiki-dark:#75DB8C">'linus@example.com'</span><span style="--shiki-light:#2B2B2B;--shiki-dark:#E1E1E1">),</span></span>
<span class="line"><span style="--shiki-light:#2B2B2B;--shiki-dark:#E1E1E1">    (</span><span style="--shiki-light:#D92038;--shiki-dark:#FF7082">4</span><span style="--shiki-light:#2B2B2B;--shiki-dark:#E1E1E1">, </span><span style="--shiki-light:#13862E;--shiki-dark:#75DB8C">'margaret'</span><span style="--shiki-light:#2B2B2B;--shiki-dark:#E1E1E1">, </span><span style="--shiki-light:#13862E;--shiki-dark:#75DB8C">'margaret@example.com'</span><span style="--shiki-light:#2B2B2B;--shiki-dark:#E1E1E1">),</span></span>
<span class="line"><span style="--shiki-light:#2B2B2B;--shiki-dark:#E1E1E1">    (</span><span style="--shiki-light:#D92038;--shiki-dark:#FF7082">5</span><span style="--shiki-light:#2B2B2B;--shiki-dark:#E1E1E1">, </span><span style="--shiki-light:#13862E;--shiki-dark:#75DB8C">'dennis'</span><span style="--shiki-light:#2B2B2B;--shiki-dark:#E1E1E1">, </span><span style="--shiki-light:#13862E;--shiki-dark:#75DB8C">'dennis@example.com'</span><span style="--shiki-light:#2B2B2B;--shiki-dark:#E1E1E1">),</span></span>
<span class="line"><span style="--shiki-light:#2B2B2B;--shiki-dark:#E1E1E1">    (</span><span style="--shiki-light:#D92038;--shiki-dark:#FF7082">6</span><span style="--shiki-light:#2B2B2B;--shiki-dark:#E1E1E1">, </span><span style="--shiki-light:#13862E;--shiki-dark:#75DB8C">'barbara'</span><span style="--shiki-light:#2B2B2B;--shiki-dark:#E1E1E1">, </span><span style="--shiki-light:#13862E;--shiki-dark:#75DB8C">'barbara@example.com'</span><span style="--shiki-light:#2B2B2B;--shiki-dark:#E1E1E1">),</span></span>
<span class="line"><span style="--shiki-light:#2B2B2B;--shiki-dark:#E1E1E1">    (</span><span style="--shiki-light:#D92038;--shiki-dark:#FF7082">7</span><span style="--shiki-light:#2B2B2B;--shiki-dark:#E1E1E1">, </span><span style="--shiki-light:#13862E;--shiki-dark:#75DB8C">'donald'</span><span style="--shiki-light:#2B2B2B;--shiki-dark:#E1E1E1">, </span><span style="--shiki-light:#13862E;--shiki-dark:#75DB8C">'donald@example.com'</span><span style="--shiki-light:#2B2B2B;--shiki-dark:#E1E1E1">),</span></span>
<span class="line"><span style="--shiki-light:#2B2B2B;--shiki-dark:#E1E1E1">    (</span><span style="--shiki-light:#D92038;--shiki-dark:#FF7082">8</span><span style="--shiki-light:#2B2B2B;--shiki-dark:#E1E1E1">, </span><span style="--shiki-light:#13862E;--shiki-dark:#75DB8C">'james'</span><span style="--shiki-light:#2B2B2B;--shiki-dark:#E1E1E1">, </span><span style="--shiki-light:#13862E;--shiki-dark:#75DB8C">'james@example.com'</span><span style="--shiki-light:#2B2B2B;--shiki-dark:#E1E1E1">);</span></span>
<span class="line"></span></code></pre></div></div><p>Each of the four shards is assigned a range of IDs that it&#x27;s responsible for storing, and the router sends the inserts to the correct shard. The insertions first get sent to the router, where it computes a hash of each ID, then forwards it along to the correct shard.</p><iframe src="https://planetscale.com/blog/many-servers-appear-as-one/iframe#shard-inserts" title="/blog/many-servers-appear-as-one/iframe#shard-inserts" loading="lazy"></iframe><p>When it comes to reads, some queries are simple enough such that the router passes them along to a single shard.</p><div class="code-block" data-language="sql"><div class="min-w-0 max-w-full"><pre class="shiki shiki-themes planetscale-light planetscale-dark" style="--shiki-light:#2b2b2b;--shiki-dark:#e1e1e1;--shiki-light-bg:#ebebeb;--shiki-dark-bg:#1a1a1a" tabindex="0"><code><span class="line"><span style="--shiki-light:#F35815;--shiki-dark:#F35815">SELECT</span><span style="--shiki-light:#2B2B2B;--shiki-dark:#E1E1E1"> email </span><span style="--shiki-light:#F35815;--shiki-dark:#F35815">from</span><span style="--shiki-light:#2B2B2B;--shiki-dark:#E1E1E1"> user </span><span style="--shiki-light:#F35815;--shiki-dark:#F35815">where</span><span style="--shiki-light:#2B2B2B;--shiki-dark:#E1E1E1"> id </span><span style="--shiki-light:#F35815;--shiki-dark:#F35815">=</span><span style="--shiki-light:#D92038;--shiki-dark:#FF7082"> 4</span><span style="--shiki-light:#2B2B2B;--shiki-dark:#E1E1E1">;</span></span>
<span class="line"></span></code></pre></div></div><p>In this case, all the router needs to do is have an internal mapping of which user IDs live in which servers, and forward that query on. Based on the example above, this would be the first (top) shard.</p><p>Some cases are more complex.</p><div class="code-block" data-language="sql"><div class="min-w-0 max-w-full"><pre class="shiki shiki-themes planetscale-light planetscale-dark" style="--shiki-light:#2b2b2b;--shiki-dark:#e1e1e1;--shiki-light-bg:#ebebeb;--shiki-dark-bg:#1a1a1a" tabindex="0"><code><span class="line"><span style="--shiki-light:#F35815;--shiki-dark:#F35815">SELECT</span><span style="--shiki-light:#2B2B2B;--shiki-dark:#E1E1E1"> email </span><span style="--shiki-light:#F35815;--shiki-dark:#F35815">FROM</span><span style="--shiki-light:#2B2B2B;--shiki-dark:#E1E1E1"> user</span></span>
<span class="line"><span style="--shiki-light:#F35815;--shiki-dark:#F35815">  WHERE</span><span style="--shiki-light:#2B2B2B;--shiki-dark:#E1E1E1"> id </span><span style="--shiki-light:#F35815;--shiki-dark:#F35815">BETWEEN</span><span style="--shiki-light:#D92038;--shiki-dark:#FF7082"> 3</span><span style="--shiki-light:#F35815;--shiki-dark:#F35815"> AND</span><span style="--shiki-light:#D92038;--shiki-dark:#FF7082"> 5</span><span style="--shiki-light:#2B2B2B;--shiki-dark:#E1E1E1">;</span></span>
<span class="line"></span></code></pre></div></div><p>Users with this range of IDs are spread out across several shards. The router must understand the data topology, create a plan for distributing the query to all shards that may contain matching results, aggregate the results back at the router, and send the full result set to the client.</p><p>Ultimately, this means the router itself must have a full query parser and routing planner built in.</p><iframe src="https://planetscale.com/blog/many-servers-appear-as-one/iframe#proxy-plan" title="/blog/many-servers-appear-as-one/iframe#proxy-plan" loading="lazy"></iframe><p>The router must be able to perform query parsing, planning, connection pooling, and buffering, all within a single system. Complex software is hard to get right.</p><h2 id="how-does-it-know"><a href="https://planetscale.com/blog/making-768-servers-look-like-1#how-does-it-know">How does it know?</a></h2><p>Every database is unique, with its own schema, tables, and query patterns. How then can a router generically know which data, and which queries, go where?</p><p>In both <a href="https://neki.dev/">Neki</a> and <a href="https://vitess.io/docs/reference/features/vschema/">Vitess</a>, these are specified via JSON files representing the data topology of the system. Vitess&#x27; VSchema and Neki&#x27;s data topology give engineers a ton of flexibility to describe precisely how tables and queries should be distributed. Below is a simplified example of how we would specify a sharding scheme for a <code>user</code> table:</p><div class="code-block" data-language="json"><div class="min-w-0 max-w-full"><pre class="shiki shiki-themes planetscale-light planetscale-dark" style="--shiki-light:#2b2b2b;--shiki-dark:#e1e1e1;--shiki-light-bg:#ebebeb;--shiki-dark-bg:#1a1a1a" tabindex="0"><code><span class="line"><span style="--shiki-light:#616161;--shiki-dark:#C1C1C1">{</span></span>
<span class="line"><span style="--shiki-light:#616161;--shiki-dark:#C1C1C1">  "</span><span style="--shiki-light:#F35815;--shiki-dark:#F35815">shard_indexes</span><span style="--shiki-light:#616161;--shiki-dark:#C1C1C1">"</span><span style="--shiki-light:#616161;--shiki-dark:#C1C1C1">:</span><span style="--shiki-light:#616161;--shiki-dark:#C1C1C1"> {</span></span>
<span class="line"><span style="--shiki-light:#616161;--shiki-dark:#C1C1C1">    "</span><span style="--shiki-light:#F35815;--shiki-dark:#F35815">user_hash</span><span style="--shiki-light:#616161;--shiki-dark:#C1C1C1">"</span><span style="--shiki-light:#616161;--shiki-dark:#C1C1C1">:</span><span style="--shiki-light:#616161;--shiki-dark:#C1C1C1"> {</span></span>
<span class="line"><span style="--shiki-light:#616161;--shiki-dark:#C1C1C1">      "</span><span style="--shiki-light:#F35815;--shiki-dark:#F35815">type</span><span style="--shiki-light:#616161;--shiki-dark:#C1C1C1">"</span><span style="--shiki-light:#616161;--shiki-dark:#C1C1C1">:</span><span style="--shiki-light:#13862E;--shiki-dark:#75DB8C"> "hash"</span></span>
<span class="line"><span style="--shiki-light:#616161;--shiki-dark:#C1C1C1">    }</span></span>
<span class="line"><span style="--shiki-light:#616161;--shiki-dark:#C1C1C1">  },</span></span>
<span class="line"><span style="--shiki-light:#616161;--shiki-dark:#C1C1C1">  "</span><span style="--shiki-light:#F35815;--shiki-dark:#F35815">tables</span><span style="--shiki-light:#616161;--shiki-dark:#C1C1C1">"</span><span style="--shiki-light:#616161;--shiki-dark:#C1C1C1">:</span><span style="--shiki-light:#616161;--shiki-dark:#C1C1C1"> {</span></span>
<span class="line"><span style="--shiki-light:#616161;--shiki-dark:#C1C1C1">    "</span><span style="--shiki-light:#F35815;--shiki-dark:#F35815">user</span><span style="--shiki-light:#616161;--shiki-dark:#C1C1C1">"</span><span style="--shiki-light:#616161;--shiki-dark:#C1C1C1">:</span><span style="--shiki-light:#616161;--shiki-dark:#C1C1C1"> {</span></span>
<span class="line"><span style="--shiki-light:#616161;--shiki-dark:#C1C1C1">      "</span><span style="--shiki-light:#F35815;--shiki-dark:#F35815">shard_by</span><span style="--shiki-light:#616161;--shiki-dark:#C1C1C1">"</span><span style="--shiki-light:#616161;--shiki-dark:#C1C1C1">:</span><span style="--shiki-light:#13862E;--shiki-dark:#75DB8C"> "user_hash"</span><span style="--shiki-light:#616161;--shiki-dark:#C1C1C1">,</span></span>
<span class="line"><span style="--shiki-light:#616161;--shiki-dark:#C1C1C1">      "</span><span style="--shiki-light:#F35815;--shiki-dark:#F35815">column</span><span style="--shiki-light:#616161;--shiki-dark:#C1C1C1">"</span><span style="--shiki-light:#616161;--shiki-dark:#C1C1C1">:</span><span style="--shiki-light:#13862E;--shiki-dark:#75DB8C"> "id"</span></span>
<span class="line"><span style="--shiki-light:#616161;--shiki-dark:#C1C1C1">    }</span></span>
<span class="line"><span style="--shiki-light:#616161;--shiki-dark:#C1C1C1">  }</span></span>
<span class="line"><span style="--shiki-light:#616161;--shiki-dark:#C1C1C1">}</span></span>
<span class="line"></span></code></pre></div></div><p>This metadata is stored in the router, and tells it that the <code>user</code> table is sharded on its <code>id</code> column using the <code>user_hash</code> shard index. This <code>user_hash</code> shard index uses the router&#x27;s built-in value hashing. For each incoming row, it hashed the ID, and uses this to send it to the correct shard to be stored.</p><p>Since this is all communicated to the router via text and JSON, AI agents are great for configuration and optimization here.</p><h2 id="many-proxies-one-database"><a href="https://planetscale.com/blog/making-768-servers-look-like-1#many-proxies-one-database">Many proxies, one database</a></h2><p>At a scale of 256 shards spanning 768 servers and millions of queries per second, we cannot route all of this traffic through a single proxy. We need many! Perhaps 10, perhaps 100, depending on the shape of the traffic.</p><p>We&#x27;d still like our apps to think of this as a single server. This is where a Network Load Balancer (NLB) helps.</p><p>NLBs have a simple job: Allow connections via a single host/IP, and assign each connection to one of many destinations. This is how traffic is distributed across the routers. Once assigned, a connection remains with the same proxy for its lifetime.</p><iframe src="https://planetscale.com/blog/many-servers-appear-as-one/iframe#full-sharded" title="/blog/many-servers-appear-as-one/iframe#full-sharded" loading="lazy"></iframe><p>In some cases, an NLB is not necessary. Eliminating an NLB adds slightly more complexity to the app server&#x27;s connection logic, as it will have to be aware of each router&#x27;s host, but eliminates a network hop, keeping round-trip latency to a minimum.</p><h2 id="the-full-picture"><a href="https://planetscale.com/blog/making-768-servers-look-like-1#the-full-picture">The full picture</a></h2><p>Now all the pieces are in place to make 768 servers storing 1,000 terabytes of data appear as a single, monolithic database to our apps.</p><ol><li>An app server is told &quot;connect to the database at <code>mydb.pscale.com</code>&quot;</li><li>A DNS lookup is performed, returning the NLB&#x27;s IP address: <code>123.152.100.4</code></li><li>The app requests to connect to the database at <code>123.152.100.4</code></li><li>This routes the connection first through the NLB, then to one of the N proxies</li><li>The app begins sending database queries, which go app -&gt; NLB (optional) -&gt; proxy -&gt; shards. The complex routing logic is hidden from the application. (NLB not pictured below, for simplicity)</li></ol><iframe src="https://planetscale.com/blog/many-servers-appear-as-one/iframe#shard-formation" title="/blog/many-servers-appear-as-one/iframe#shard-formation" loading="lazy"></iframe><p>This example shows scaling up to 1 petabyte, but sharding should begin long before this scale. The precise recommendations depend on each database&#x27;s size, schema, and QPS, but we recommend sharding Postgres and MySQL for anything beyond a few terabytes of data. That&#x27;s the point where you typically begin hitting the bottlenecks described earlier: long backups, write bottlenecks, etc. If you are facing challenges scaling relational databases, Neki and Vitess are the solutions.</p><p><a href="https://planetscale.com/vitess">Vitess</a> for MySQL has been used for over a decade to scale the world&#x27;s biggest relational databases. We have years of experience operating large, sharded databases for our customers, and are the core maintainers of the Vitess project. <a href="https://planetscale.com/neki">Neki</a> was developed by the same expert maintainers of Vitess, bringing an even more powerful sharding system to Postgres.</p><h2 id="what-about-everything-else"><a href="https://planetscale.com/blog/making-768-servers-look-like-1#what-about-everything-else">What about everything else?</a></h2><p>We&#x27;ve only scratched the surface of everything sharding systems like Neki and Vitess provide. There are so many other interesting details. What&#x27;s the best way to shard data? How do sharded databases handle failures? How do you change the number of shards? How do you take backups across 256 shards at the same time?</p><p>Stay tuned for more here. Follow our <a href="https://planetscale.com/blog/feed.atom">RSS feed</a> or on <a href="https://x.com/planetscale">X</a> to stay in the loop.</p><p>Happy sharding.</p>]]></content>
    <summary><![CDATA[How to make 768 distinct Postgres servers look like 1 to your applications.]]></summary>
  </entry>
  <entry>
    <title>The feedback loops behind Kubernetes</title>
    <link href="https://planetscale.com/blog/the-feedback-loops-behind-kubernetes"/>
    <id>https://planetscale.com/blog/the-feedback-loops-behind-kubernetes</id>
    <published>2026-06-16T00:00:00.000Z</published>
    <updated>2026-06-16T00:00:00.000Z</updated>
    <author>
      <name>Fatih Arslan</name>
    </author>
    <category term="engineering"/>
    <content type="html"><![CDATA[<p>For the last decade, Kubernetes has been the backdrop to most of my work: operating clusters, helping build hosted Kubernetes, and writing Kubernetes operators. At PlanetScale, that now means running stateful systems like Postgres and MySQL in production. Kubernetes has many faces, but here I want to talk about one face only: why it is so good at running workloads at scale.</p><p>People ask me what an operator actually does. The canonical answer is: &quot;it reconciles desired state.&quot; This is correct, but it also tells you almost nothing.</p><p>An operator is a feedback controller. It&#x27;s the same closed loop that runs a thermostat or keeps your car at a fixed speed on cruise control. In our case, the thing being controlled is a database. I have been building these loops for years, and the best way I know to make them click is to ignore Kubernetes at the beginning. Kubernetes is full of control theory, even if we don&#x27;t call it that in the day-to-day.</p><p>Before we look at a single line of Kubernetes, we&#x27;re going to run a production database by hand and slowly let the feedback loop appear on its own. Then we&#x27;ll map that loop to Kubernetes, with the pieces production needs: a store, watches, queues, retries, and more. At the end, we&#x27;ll look at what one of these loops looks like in a real operator.</p><div class="mb-3 border p-3 border-blue-600 dark:border-blue-500"><p><span class="bg-blue-600 px-sm text-white dark:bg-blue-500 dark:text-black">Note</span></p><p>A working understanding of containers and <code>kubectl</code> helps, but you don&#x27;t need to be a Kubernetes expert. I&#x27;ll use terms like <em>idempotent</em>, <em>fan-in</em>, and <em>eventual consistency</em>, and introduce the parts that matter as we go.</p><p>We&#x27;re going to start slow and gradually ramp things up. Each part builds on the previous.</p></div><hr><h2 id="part-1-running-postgres-by-hand"><a href="https://planetscale.com/blog/the-feedback-loops-behind-kubernetes#part-1-running-postgres-by-hand">Part 1: running Postgres by hand</a></h2><h3 id="one-container-one-machine"><a href="https://planetscale.com/blog/the-feedback-loops-behind-kubernetes#one-container-one-machine">One container, one machine</a></h3><p>Let&#x27;s start from scratch. I want to run Postgres on a Linux box, and I need it inside a container. To start it, we run:</p><div class="code-block" data-language="bash"><div class="min-w-0 max-w-full"><pre class="shiki shiki-themes planetscale-light planetscale-dark" style="--shiki-light:#2b2b2b;--shiki-dark:#e1e1e1;--shiki-light-bg:#ebebeb;--shiki-dark-bg:#1a1a1a" tabindex="0"><code><span class="line"><span style="--shiki-light:#F35815;--shiki-dark:#F35815">docker</span><span style="--shiki-light:#414141;--shiki-dark:#C1C1C1"> run</span><span style="--shiki-light:#0B6EC5;--shiki-dark:#73C7F9"> -</span><span style="--shiki-light:#7D5903;--shiki-dark:#FED54A">d</span><span style="--shiki-light:#0B6EC5;--shiki-dark:#73C7F9"> -</span><span style="--shiki-light:#7D5903;--shiki-dark:#FED54A">-name</span><span style="--shiki-light:#414141;--shiki-dark:#C1C1C1"> pg</span><span style="--shiki-light:#7D5903;--shiki-dark:#FED54A"> \</span></span>
<span class="line"><span style="--shiki-light:#0B6EC5;--shiki-dark:#73C7F9">  -</span><span style="--shiki-light:#7D5903;--shiki-dark:#FED54A">e</span><span style="--shiki-light:#414141;--shiki-dark:#C1C1C1"> POSTGRES_PASSWORD=secret</span><span style="--shiki-light:#7D5903;--shiki-dark:#FED54A"> \</span></span>
<span class="line"><span style="--shiki-light:#414141;--shiki-dark:#C1C1C1">  postgres:18</span></span>
<span class="line"></span></code></pre></div></div><p>That&#x27;s it. Postgres is running. My app connects to it, writes some rows, and everything works fine. But then the machine goes away: the cloud provider reclaims the instance (hardware fails, or a spot instance gets taken back), or I ship a new version of my setup, which means stopping the old container and starting a fresh one in its place. Either way, the container is replaced, and my data is gone. The container storage was ephemeral, and I did not attach any persistent volume to it.</p><p>There is already a gap between what I <em>want</em> (Postgres, running, with my data) and what I <em>have</em> (a container whose storage disappears when the container or node goes away). The rest of this post is about that gap and the machinery we build to close it.</p><h3 id="pick-a-node-by-hand"><a href="https://planetscale.com/blog/the-feedback-loops-behind-kubernetes#pick-a-node-by-hand">Pick a node, by hand</a></h3><p>Imagine we have hundreds of nodes (servers) we can use. I already have other workloads running on them. I need to decide <em>which one</em> runs this database. So I <code>ssh</code> into the box that looks the least busy and start the container there.</p><div class="code-block" data-language="bash"><div class="min-w-0 max-w-full"><pre class="shiki shiki-themes planetscale-light planetscale-dark" style="--shiki-light:#2b2b2b;--shiki-dark:#e1e1e1;--shiki-light-bg:#ebebeb;--shiki-dark-bg:#1a1a1a" tabindex="0"><code><span class="line"><span style="--shiki-light:#F35815;--shiki-dark:#F35815">ssh</span><span style="--shiki-light:#414141;--shiki-dark:#C1C1C1"> node-07</span><span style="--shiki-light:#13862E;--shiki-dark:#75DB8C"> 'docker run -d --name pg ... postgres:18'</span></span>
<span class="line"></span></code></pre></div></div><p>I picked <code>node-07</code> because it looked idle enough. I start keeping track of it, save it in some sort of config file, and push it to some repo.</p><h3 id="it-needs-a-real-disk"><a href="https://planetscale.com/blog/the-feedback-loops-behind-kubernetes#it-needs-a-real-disk">It needs a real disk</a></h3><p>Container storage is ephemeral, so I have to attach a real block device. In the cloud this is an EBS volume (e.g. on AWS); on bare metal it&#x27;s a physical disk. Assuming it&#x27;s a block device, this is what we usually do: provision the volume, attach it to the node, format it, mount it, and point Postgres&#x27; data directory at the mount.</p><div class="code-block" data-language="bash"><div class="min-w-0 max-w-full"><pre class="shiki shiki-themes planetscale-light planetscale-dark" style="--shiki-light:#2b2b2b;--shiki-dark:#e1e1e1;--shiki-light-bg:#ebebeb;--shiki-dark-bg:#1a1a1a" tabindex="0"><code><span class="line"><span style="--shiki-light:#818181;--shiki-dark:#A1A1A1"># provision + attach first with cloud CLI, then on the node:</span></span>
<span class="line"><span style="--shiki-light:#F35815;--shiki-dark:#F35815">mkfs.ext4</span><span style="--shiki-light:#414141;--shiki-dark:#C1C1C1"> /dev/nvme1n1</span></span>
<span class="line"><span style="--shiki-light:#F35815;--shiki-dark:#F35815">mkdir</span><span style="--shiki-light:#0B6EC5;--shiki-dark:#73C7F9"> -</span><span style="--shiki-light:#7D5903;--shiki-dark:#FED54A">p</span><span style="--shiki-light:#414141;--shiki-dark:#C1C1C1"> /var/lib/pg-data</span></span>
<span class="line"><span style="--shiki-light:#F35815;--shiki-dark:#F35815">mount</span><span style="--shiki-light:#414141;--shiki-dark:#C1C1C1"> /dev/nvme1n1</span><span style="--shiki-light:#414141;--shiki-dark:#C1C1C1"> /var/lib/pg-data</span></span>
<span class="line"><span style="--shiki-light:#F35815;--shiki-dark:#F35815">docker</span><span style="--shiki-light:#414141;--shiki-dark:#C1C1C1"> run</span><span style="--shiki-light:#0B6EC5;--shiki-dark:#73C7F9"> -</span><span style="--shiki-light:#7D5903;--shiki-dark:#FED54A">d</span><span style="--shiki-light:#0B6EC5;--shiki-dark:#73C7F9"> -</span><span style="--shiki-light:#7D5903;--shiki-dark:#FED54A">-name</span><span style="--shiki-light:#414141;--shiki-dark:#C1C1C1"> pg</span><span style="--shiki-light:#7D5903;--shiki-dark:#FED54A"> \</span></span>
<span class="line"><span style="--shiki-light:#0B6EC5;--shiki-dark:#73C7F9">  -</span><span style="--shiki-light:#7D5903;--shiki-dark:#FED54A">e</span><span style="--shiki-light:#414141;--shiki-dark:#C1C1C1"> POSTGRES_PASSWORD=secret</span><span style="--shiki-light:#7D5903;--shiki-dark:#FED54A"> \</span></span>
<span class="line"><span style="--shiki-light:#0B6EC5;--shiki-dark:#73C7F9">  -</span><span style="--shiki-light:#7D5903;--shiki-dark:#FED54A">v</span><span style="--shiki-light:#414141;--shiki-dark:#C1C1C1"> /var/lib/pg-data:/var/lib/postgresql</span><span style="--shiki-light:#7D5903;--shiki-dark:#FED54A"> \</span></span>
<span class="line"><span style="--shiki-light:#414141;--shiki-dark:#C1C1C1">  postgres:18</span></span>
<span class="line"></span></code></pre></div></div><p>These are a lot of steps, and each one can fail halfway. And if the disk fills up later, Postgres stops accepting writes and we have to resize the volume by hand: first through the cloud provider, then again inside the filesystem.</p><h3 id="one-isnt-enough"><a href="https://planetscale.com/blog/the-feedback-loops-behind-kubernetes#one-isnt-enough">One isn&#x27;t enough</a></h3><p>A single Postgres instance is a single point of failure. We want high availability: one primary and two replicas. These need to be on three different machines, with streaming replication between them. So we do the same steps again, three times, on <code>node-07</code>, <code>node-12</code>, and <code>node-19</code>. I also wire up replication by hand: <code>primary_conninfo</code>, replication slots, all of it.</p><p>Now we have three nodes with three Postgres instances. One of the instances is the primary (here it&#x27;s <code>node-07</code>). But this raises new problems, like what to do if the primary&#x27;s node dies?</p><h3 id="they-have-to-find-each-other"><a href="https://planetscale.com/blog/the-feedback-loops-behind-kubernetes#they-have-to-find-each-other">They have to find each other</a></h3><p>Here is another thing we have to solve. The replicas need to reach the primary, and the primary needs to accept their connections. And every one of these addresses is an IP that changes when a container restarts.</p><p>The first thing I do is hard-code the IPs. I write <code>node-07</code>&#x27;s address into the replicas&#x27; config, I list the replicas&#x27; addresses in the primary&#x27;s <code>pg_hba.conf</code>, and I keep a small <code>/etc/hosts</code> table and save it somewhere.</p><div class="code-block" data-language="conf"><div class="min-w-0 max-w-full"><pre class="shiki shiki-themes planetscale-light planetscale-dark" style="--shiki-light:#2b2b2b;--shiki-dark:#e1e1e1;--shiki-light-bg:#ebebeb;--shiki-dark-bg:#1a1a1a" tabindex="0"><code><span class="line"><span># on each replica's postgresql.auto.conf, until the primary is recreated with a new IP</span></span>
<span class="line"><span>primary_conninfo = 'host=10.4.7.21 port=5432 user=replicator ...'</span></span>
<span class="line"><span></span></span></code></pre></div></div><p>But we still have a problem: the first time the primary is recreated with a different IP, the whole cluster falls apart.</p><p><picture class="block"><source media="(prefers-color-scheme: light), (prefers-color-scheme: no-preference)" srcSet="https://planetscale-images.imgix.net/assets/part1-manual-cluster-C6iQCdoL.png?auto=compress%2Cformat"><source media="(prefers-color-scheme: dark)" srcSet="https://planetscale-images.imgix.net/assets/part1-manual-cluster-darkmode-VBZiV-Rl.png?auto=compress%2Cformat"><img alt="Manual Postgres cluster diagram" src="https://planetscale-images.imgix.net/assets/part1-manual-cluster-C6iQCdoL.png?auto=compress%2Cformat" width="1504" height="1007" loading="lazy"></picture></p><h3 id="the-watchdog-script"><a href="https://planetscale.com/blog/the-feedback-loops-behind-kubernetes#the-watchdog-script">The watchdog script</a></h3><p>Now, this is where we start thinking about how to solve these issues. Everything described so far can break, and will continue to break even if I fix it:</p><ul><li>A replica process dies and doesn&#x27;t come back.</li><li>A disk gets full.</li><li>The primary fails and a replica has to be promoted.</li><li>A config I changed on two nodes but forgot on the third one. They are now out of sync.</li></ul><p>Let&#x27;s assume we&#x27;ve set up a simple uptime monitor and we&#x27;re going to get paged for all these cases. To avoid getting paged at night, we do the sensible thing: write a script. So we decide to write a loop that wakes up every few seconds, looks at each node, and fixes whatever&#x27;s wrong.</p><div class="code-block" data-language="bash"><div class="min-w-0 max-w-full"><pre class="shiki shiki-themes planetscale-light planetscale-dark" style="--shiki-light:#2b2b2b;--shiki-dark:#e1e1e1;--shiki-light-bg:#ebebeb;--shiki-dark-bg:#1a1a1a" tabindex="0"><code><span class="line"><span style="--shiki-light:#F35815;--shiki-dark:#F35815">while</span><span style="--shiki-light:#0B6EC5;--shiki-dark:#73C7F9"> true</span><span style="--shiki-light:#616161;--shiki-dark:#C1C1C1">;</span><span style="--shiki-light:#F35815;--shiki-dark:#F35815"> do</span></span>
<span class="line"><span style="--shiki-light:#F35815;--shiki-dark:#F35815">  for</span><span style="--shiki-light:#A78103;--shiki-dark:#F2B600"> node</span><span style="--shiki-light:#F35815;--shiki-dark:#F35815"> in</span><span style="--shiki-light:#414141;--shiki-dark:#C1C1C1"> node-07</span><span style="--shiki-light:#414141;--shiki-dark:#C1C1C1"> node-12</span><span style="--shiki-light:#414141;--shiki-dark:#C1C1C1"> node-19</span><span style="--shiki-light:#616161;--shiki-dark:#C1C1C1">;</span><span style="--shiki-light:#F35815;--shiki-dark:#F35815"> do</span></span>
<span class="line"><span style="--shiki-light:#F35815;--shiki-dark:#F35815">    if</span><span style="--shiki-light:#F35815;--shiki-dark:#F35815"> !</span><span style="--shiki-light:#F35815;--shiki-dark:#F35815"> ssh</span><span style="--shiki-light:#13862E;--shiki-dark:#75DB8C"> "</span><span style="--shiki-light:#A78103;--shiki-dark:#F2B600">$node</span><span style="--shiki-light:#13862E;--shiki-dark:#75DB8C">"</span><span style="--shiki-light:#13862E;--shiki-dark:#75DB8C"> 'pg_isready -q'</span><span style="--shiki-light:#616161;--shiki-dark:#C1C1C1">;</span><span style="--shiki-light:#F35815;--shiki-dark:#F35815"> then</span></span>
<span class="line"><span style="--shiki-light:#F35815;--shiki-dark:#F35815">      ssh</span><span style="--shiki-light:#13862E;--shiki-dark:#75DB8C"> "</span><span style="--shiki-light:#A78103;--shiki-dark:#F2B600">$node</span><span style="--shiki-light:#13862E;--shiki-dark:#75DB8C">"</span><span style="--shiki-light:#13862E;--shiki-dark:#75DB8C"> 'docker start pg'</span><span style="--shiki-light:#818181;--shiki-dark:#A1A1A1">       # it died, bring it back</span></span>
<span class="line"><span style="--shiki-light:#F35815;--shiki-dark:#F35815">    fi</span></span>
<span class="line"></span>
<span class="line"><span style="--shiki-light:#A78103;--shiki-dark:#F2B600">    usage</span><span style="--shiki-light:#F35815;--shiki-dark:#F35815">=</span><span style="--shiki-light:#616161;--shiki-dark:#C1C1C1">$(</span><span style="--shiki-light:#F35815;--shiki-dark:#F35815">ssh</span><span style="--shiki-light:#13862E;--shiki-dark:#75DB8C"> "</span><span style="--shiki-light:#A78103;--shiki-dark:#F2B600">$node</span><span style="--shiki-light:#13862E;--shiki-dark:#75DB8C">"</span><span style="--shiki-light:#13862E;--shiki-dark:#75DB8C"> "df --output=pcent /var/lib/pg-data | tail -1 | tr -dc 0-9"</span><span style="--shiki-light:#616161;--shiki-dark:#C1C1C1">)</span></span>
<span class="line"><span style="--shiki-light:#F35815;--shiki-dark:#F35815">    if</span><span style="--shiki-light:#616161;--shiki-dark:#C1C1C1"> [</span><span style="--shiki-light:#13862E;--shiki-dark:#75DB8C"> "</span><span style="--shiki-light:#A78103;--shiki-dark:#F2B600">$usage</span><span style="--shiki-light:#13862E;--shiki-dark:#75DB8C">"</span><span style="--shiki-light:#F35815;--shiki-dark:#F35815"> -gt</span><span style="--shiki-light:#D92038;--shiki-dark:#FF7082"> 80</span><span style="--shiki-light:#616161;--shiki-dark:#C1C1C1"> ];</span><span style="--shiki-light:#F35815;--shiki-dark:#F35815"> then</span></span>
<span class="line"><span style="--shiki-light:#F35815;--shiki-dark:#F35815">      grow_volume</span><span style="--shiki-light:#13862E;--shiki-dark:#75DB8C"> "</span><span style="--shiki-light:#A78103;--shiki-dark:#F2B600">$node</span><span style="--shiki-light:#13862E;--shiki-dark:#75DB8C">"</span><span style="--shiki-light:#818181;--shiki-dark:#A1A1A1">                  # disk filling, make it bigger</span></span>
<span class="line"><span style="--shiki-light:#F35815;--shiki-dark:#F35815">    fi</span></span>
<span class="line"><span style="--shiki-light:#F35815;--shiki-dark:#F35815">  done</span></span>
<span class="line"><span style="--shiki-light:#F35815;--shiki-dark:#F35815">  sleep</span><span style="--shiki-light:#D92038;--shiki-dark:#FF7082"> 5</span></span>
<span class="line"><span style="--shiki-light:#F35815;--shiki-dark:#F35815">done</span></span>
<span class="line"></span></code></pre></div></div><p>It&#x27;s written in Bash, and probably has tons of bugs. You notice something here? The loop doesn&#x27;t care <em>how</em> the database got into a bad state. Every five seconds it looks at the current state of the world and asks this question: does reality match what I want?</p><p>If a process is down, start it. If a disk is filling, grow it. Run the loop once or run it a thousand times and the result is the same, because each action is conditional on the current state. The script is <em>idempotent</em>.</p><h3 id="changing-a-parameter"><a href="https://planetscale.com/blog/the-feedback-loops-behind-kubernetes#changing-a-parameter">Changing a parameter</a></h3><p>Let&#x27;s make things a little more complex. I need to raise <a href="https://www.postgresql.org/docs/current/runtime-config-connection.html#GUC-MAX-CONNECTIONS"><code>max_connections</code></a> from 100 to 500. This one is not a reload-only change. PostgreSQL says it can only be set at server start, so the manual version is to <code>ssh</code> into each box, edit <code>postgresql.conf</code>, restart Postgres, and check that it took on all three.</p><p>Because I know that ssh&#x27;ing into the nodes manually isn&#x27;t a thing I want anymore, I do the same thing we did previously: I write the desired value down in one place and teach the loop to enforce it.</p><div class="code-block" data-language="bash"><div class="min-w-0 max-w-full"><pre class="shiki shiki-themes planetscale-light planetscale-dark" style="--shiki-light:#2b2b2b;--shiki-dark:#e1e1e1;--shiki-light-bg:#ebebeb;--shiki-dark-bg:#1a1a1a" tabindex="0"><code><span class="line"><span style="--shiki-light:#A78103;--shiki-dark:#F2B600">WANT_MAX_CONNECTIONS</span><span style="--shiki-light:#F35815;--shiki-dark:#F35815">=</span><span style="--shiki-light:#414141;--shiki-dark:#C1C1C1">500</span></span>
<span class="line"></span>
<span class="line"><span style="--shiki-light:#F35815;--shiki-dark:#F35815">for</span><span style="--shiki-light:#A78103;--shiki-dark:#F2B600"> node</span><span style="--shiki-light:#F35815;--shiki-dark:#F35815"> in</span><span style="--shiki-light:#414141;--shiki-dark:#C1C1C1"> node-07</span><span style="--shiki-light:#414141;--shiki-dark:#C1C1C1"> node-12</span><span style="--shiki-light:#414141;--shiki-dark:#C1C1C1"> node-19</span><span style="--shiki-light:#616161;--shiki-dark:#C1C1C1">;</span><span style="--shiki-light:#F35815;--shiki-dark:#F35815"> do</span></span>
<span class="line"><span style="--shiki-light:#A78103;--shiki-dark:#F2B600">  have</span><span style="--shiki-light:#F35815;--shiki-dark:#F35815">=</span><span style="--shiki-light:#616161;--shiki-dark:#C1C1C1">$(</span><span style="--shiki-light:#F35815;--shiki-dark:#F35815">ssh</span><span style="--shiki-light:#13862E;--shiki-dark:#75DB8C"> "</span><span style="--shiki-light:#A78103;--shiki-dark:#F2B600">$node</span><span style="--shiki-light:#13862E;--shiki-dark:#75DB8C">"</span><span style="--shiki-light:#13862E;--shiki-dark:#75DB8C"> "psql -tAc 'show max_connections'"</span><span style="--shiki-light:#616161;--shiki-dark:#C1C1C1">)</span></span>
<span class="line"><span style="--shiki-light:#F35815;--shiki-dark:#F35815">  if</span><span style="--shiki-light:#616161;--shiki-dark:#C1C1C1"> [</span><span style="--shiki-light:#13862E;--shiki-dark:#75DB8C"> "</span><span style="--shiki-light:#A78103;--shiki-dark:#F2B600">$have</span><span style="--shiki-light:#13862E;--shiki-dark:#75DB8C">"</span><span style="--shiki-light:#F35815;--shiki-dark:#F35815"> !=</span><span style="--shiki-light:#13862E;--shiki-dark:#75DB8C"> "</span><span style="--shiki-light:#A78103;--shiki-dark:#F2B600">$WANT_MAX_CONNECTIONS</span><span style="--shiki-light:#13862E;--shiki-dark:#75DB8C">"</span><span style="--shiki-light:#616161;--shiki-dark:#C1C1C1"> ];</span><span style="--shiki-light:#F35815;--shiki-dark:#F35815"> then</span></span>
<span class="line"><span style="--shiki-light:#F35815;--shiki-dark:#F35815">    ssh</span><span style="--shiki-light:#13862E;--shiki-dark:#75DB8C"> "</span><span style="--shiki-light:#A78103;--shiki-dark:#F2B600">$node</span><span style="--shiki-light:#13862E;--shiki-dark:#75DB8C">"</span><span style="--shiki-light:#13862E;--shiki-dark:#75DB8C"> "sed -i 's/^max_connections.*/max_connections = </span><span style="--shiki-light:#A78103;--shiki-dark:#F2B600">$WANT_MAX_CONNECTIONS</span><span style="--shiki-light:#13862E;--shiki-dark:#75DB8C">/' /var/lib/pg-data/postgresql.conf"</span></span>
<span class="line"><span style="--shiki-light:#F35815;--shiki-dark:#F35815">    ssh</span><span style="--shiki-light:#13862E;--shiki-dark:#75DB8C"> "</span><span style="--shiki-light:#A78103;--shiki-dark:#F2B600">$node</span><span style="--shiki-light:#13862E;--shiki-dark:#75DB8C">"</span><span style="--shiki-light:#13862E;--shiki-dark:#75DB8C"> "docker restart pg"</span></span>
<span class="line"><span style="--shiki-light:#F35815;--shiki-dark:#F35815">  fi</span></span>
<span class="line"><span style="--shiki-light:#F35815;--shiki-dark:#F35815">done</span></span>
<span class="line"></span></code></pre></div></div><p>This is the same idea as before. I read what I <em>want</em> (a variable). Observe what I <em>have</em> (a query). If they differ, I take an action to close the difference. Again, I don&#x27;t track whether I changed it last time. All I do is compare and <a href="https://dictionary.cambridge.org/dictionary/english/converge">converge</a>, every loop.</p><h3 id="what-we-actually-built"><a href="https://planetscale.com/blog/the-feedback-loops-behind-kubernetes#what-we-actually-built">What we actually built</a></h3><p>I started with a desired state that was written down in one place: three instances, this disk size, <code>max_connections = 500</code>. Every few seconds I observe the actual state of the system. I compute the difference. I take whatever action closes that difference. Then I do it again, forever.</p><p>That&#x27;s a <strong>closed feedback loop</strong>. The word &quot;closed&quot; matters. It means the output of the system is fed back into the next decision. I don&#x27;t run <code>docker start</code> and assume the database is fine. I check the database again. If it is still wrong, I act again. If it is already correct, I do nothing.</p><p>The nice part is that the same loop works for different problems. It can restart a dead process, grow a disk, or push <code>max_connections = 500</code>. The action changes, but the shape stays the same: read what I want, observe what I have, compare them, act, repeat. If I draw the same thing as a block diagram, with the control theory names added, it would look like this:</p><p><picture class="block"><source media="(prefers-color-scheme: light), (prefers-color-scheme: no-preference)" srcSet="https://planetscale-images.imgix.net/assets/part1-feedback-loop-Z0q4qAPX.png?auto=compress%2Cformat"><source media="(prefers-color-scheme: dark)" srcSet="https://planetscale-images.imgix.net/assets/part1-feedback-loop-darkmode-BeMyZLwB.png?auto=compress%2Cformat"><img alt="Closed feedback loop diagram" src="https://planetscale-images.imgix.net/assets/part1-feedback-loop-Z0q4qAPX.png?auto=compress%2Cformat" width="1504" height="564" loading="lazy"></picture></p><p>Here is how the vocabulary from <a href="https://en.wikipedia.org/wiki/Control_theory">control theory</a> maps cleanly onto my shell script:</p><ul><li>The <strong>setpoint</strong> is my desired state, the variables at the top of the script (disk size, max_connections and so on).</li><li>The <strong>measured output</strong> is what I observe: <code>pg_isready</code>, <code>df</code>, <code>show max_connections</code>.</li><li>The <strong>error</strong> (e) is the difference between them.</li><li>The <strong>controller</strong> is the body of the loop, the <code>if</code> statements that decide what to do. It is not the whole script.</li><li>The <strong>actuator</strong> is what carries out the action: <code>ssh</code> plus <code>docker start</code>.</li><li>The <strong>plant</strong> is the system being controlled, Postgres and its disk.</li></ul><p>That also gives us a nice way to understand <strong>open-loop</strong> control. My very first attempt, <code>ssh</code> in, run the command, and walk away, was open-loop: fire an action and assume it worked. The Bash script is closed-loop because it keeps feeding the measured state back into the next decision.</p><p>A Bash loop is not a production control plane. Just to name a few issues with it:</p><ul><li>It has no concurrency control, so two copies of the script can race each other. Imagine both deciding to promote a different replica.</li><li>It keeps its only real state, &quot;am I mid-failover?&quot;, in a shell variable that could die with the process.</li><li>It polls every node every five seconds whether anything changed or not, which is fine for three nodes, but too expensive for three thousand nodes.</li><li>It has no idea what to do when the <code>ssh</code> itself times out.</li><li>And the moment I want a second kind of resource, a connection pooler, a backup job, a read replica in another region, I&#x27;m copy-pasting this whole structure.</li></ul><p>What if the script also fails? Who runs it then? We could keep hardening this script, but look at where it goes: we would need a real store for the desired state, watches instead of polling, a work queue, retries, leader election. We would be rebuilding Kubernetes. The real platform already exists, and it&#x27;s Kubernetes.</p><hr><h2 id="part-2-how-we-reinvented-kubernetes"><a href="https://planetscale.com/blog/the-feedback-loops-behind-kubernetes#part-2-how-we-reinvented-kubernetes">Part 2: how we reinvented Kubernetes</a></h2><p>Now we can map what we hand-rolled in Part 1 to Kubernetes. Almost all of it already exists there. The operator is the part we care about.</p><h3 id="the-other-loops"><a href="https://planetscale.com/blog/the-feedback-loops-behind-kubernetes#the-other-loops">The other loops</a></h3><p>Let&#x27;s go through some of the pieces we built by hand before the watchdog loop. You already know these components by name. What you might not have noticed is that they also work like controllers.</p><p><strong>Spinning up the container: the kubelet.</strong> First, a quick definition: a Pod is the smallest thing Kubernetes runs, one or more containers scheduled together on a node and sharing its network. For us it&#x27;s the Postgres container. On every node runs an agent called the kubelet. Its desired state is the set of Pods assigned to its node, which it learns from the API server. Its observed state is the set of containers actually running, which it gets from the container runtime. When they differ, it starts the missing container, kills the extra one, or restarts the crashed one. My <code>if ! pg_isready; then docker start; fi</code> is the kubelet&#x27;s job, just done properly. The kubelet doesn&#x27;t shell into anything; it talks to containerd over a gRPC socket, which talks to runc.</p><p><strong>Picking a node: the scheduler.</strong> Remember me choosing <code>node-07</code>? That&#x27;s the scheduler&#x27;s whole reason to exist. It watches for Pods with no node assigned, filters out the nodes that can&#x27;t work, scores the rest, and writes the decision to one field: <code>pod.Spec.NodeName</code>. The scheduler doesn&#x27;t start the container; it records the placement and lets the kubelet pick it up. You will realize that most things in Kubernetes are decoupled like this.</p><p><strong>Attaching the disk: CSI and the PV/PVC sync.</strong> My multi-step <code>mkfs</code> and <code>mount</code> script becomes a <code>PersistentVolumeClaim</code>, which is a declarative request for storage. The <a href="https://github.com/container-storage-interface/spec/blob/master/spec.md">Container Storage Interface (CSI)</a> driver turns that request into a real volume. CSI itself is a set of controllers and sidecars: one provisions, one attaches, one resizes, and so on, while the kubelet calls the driver&#x27;s node plugin to do the actual mount. It&#x27;s a family of controllers. If there is a PVC but no disk behind it, one controller creates the disk. If the PVC size increases, another controller calls the provider API (e.g., AWS <code>ModifyVolume</code>). Again, I write intent, and a controller does the actual work. (note: I wrote one of the early production CSI drivers, <a href="https://github.com/digitalocean/csi-digitalocean">csi-digitalocean</a>, and a <a href="https://arslan.io/2018/06/21/how-to-write-a-container-storage-interface-csi-plugin/">long post about building one</a>.)</p><p><strong>Making them find each other: the CNI and Services.</strong> The <code>/etc/hosts</code> problem is solved at a layer we no longer have to think about. A CNI plugin gives Pods their network identity; Cilium, for example, does this with eBPF instead of a pile of <code>iptables</code> rules. For stateful workloads, a StatefulSet plus a <a href="https://kubernetes.io/docs/concepts/services-networking/service/#headless-services">headless Service</a> gives each replica its own stable DNS name, which is exactly what a Postgres replica needs. The hard-coded IP that broke our cluster becomes a name that keeps working. DNS is only one tool here; other service discovery systems like etcd, ZooKeeper, and Consul solve similar problems.</p><p>As you see, all the problems we solved with <code>ssh</code> and various scripts are replaced by Kubernetes components and drivers. And these are just a few of them:</p><p><picture class="block"><source media="(prefers-color-scheme: light), (prefers-color-scheme: no-preference)" srcSet="https://planetscale-images.imgix.net/assets/part2-kubernetes-mapping-BqGHE4E0.png?auto=compress%2Cformat"><source media="(prefers-color-scheme: dark)" srcSet="https://planetscale-images.imgix.net/assets/part2-kubernetes-mapping-darkmode-CAz9s2jY.png?auto=compress%2Cformat"><img alt="Mapping manual operations to Kubernetes controllers" src="https://planetscale-images.imgix.net/assets/part2-kubernetes-mapping-BqGHE4E0.png?auto=compress%2Cformat" width="1504" height="883" loading="lazy"></picture></p><p>All of this so far is useful context, but the part we care about is <em>our watchdog</em> loop, because that&#x27;s the one we get to write ourselves.</p><p>That&#x27;s the operator.</p><h3 id="the-for-loop-translated-to-kubernetes"><a href="https://planetscale.com/blog/the-feedback-loops-behind-kubernetes#the-for-loop-translated-to-kubernetes">The for-loop translated to Kubernetes</a></h3><p>In Kubernetes, our watchdog script is a <strong>controller</strong>, and the standard way to write one in Go is a library called <a href="https://github.com/kubernetes-sigs/controller-runtime">controller-runtime</a>. At its heart, it&#x27;s a function with a basic signature:</p><div class="code-block" data-language="go"><div class="min-w-0 max-w-full"><pre class="shiki shiki-themes planetscale-light planetscale-dark" style="--shiki-light:#2b2b2b;--shiki-dark:#e1e1e1;--shiki-light-bg:#ebebeb;--shiki-dark-bg:#1a1a1a" tabindex="0"><code><span class="line"><span style="--shiki-light:#F35815;--shiki-dark:#F35815">func</span><span style="--shiki-light:#616161;--shiki-dark:#C1C1C1"> (</span><span style="--shiki-light:#A78103;--shiki-dark:#F2B600">r </span><span style="--shiki-light:#F35815;--shiki-dark:#F35815">*Reconciler</span><span style="--shiki-light:#616161;--shiki-dark:#C1C1C1">)</span><span style="--shiki-light:#5E49AF;--shiki-dark:#B7A5FB"> Reconcile</span><span style="--shiki-light:#616161;--shiki-dark:#C1C1C1">(</span><span style="--shiki-light:#A78103;--shiki-dark:#F2B600">ctx</span><span style="--shiki-light:#F35815;--shiki-dark:#F35815"> context</span><span style="--shiki-light:#616161;--shiki-dark:#C1C1C1">.</span><span style="--shiki-light:#F35815;--shiki-dark:#F35815">Context</span><span style="--shiki-light:#616161;--shiki-dark:#C1C1C1">,</span><span style="--shiki-light:#A78103;--shiki-dark:#F2B600"> req</span><span style="--shiki-light:#F35815;--shiki-dark:#F35815"> reconcile</span><span style="--shiki-light:#616161;--shiki-dark:#C1C1C1">.</span><span style="--shiki-light:#F35815;--shiki-dark:#F35815">Request</span><span style="--shiki-light:#616161;--shiki-dark:#C1C1C1">)</span><span style="--shiki-light:#616161;--shiki-dark:#C1C1C1"> (</span><span style="--shiki-light:#F35815;--shiki-dark:#F35815">reconcile</span><span style="--shiki-light:#616161;--shiki-dark:#C1C1C1">.</span><span style="--shiki-light:#F35815;--shiki-dark:#F35815">Result</span><span style="--shiki-light:#616161;--shiki-dark:#C1C1C1">,</span><span style="--shiki-light:#F35815;--shiki-dark:#F35815"> error</span><span style="--shiki-light:#616161;--shiki-dark:#C1C1C1">)</span><span style="--shiki-light:#616161;--shiki-dark:#C1C1C1"> {</span></span>
<span class="line"><span style="--shiki-light:#818181;--shiki-dark:#A1A1A1">    // req contains a namespace/name. That's it. That's the whole input.</span></span>
<span class="line"><span style="--shiki-light:#616161;--shiki-dark:#C1C1C1">}</span></span>
<span class="line"></span></code></pre></div></div><p>Notice what is missing here: the function isn&#x27;t told what changed. There is no diff. It isn&#x27;t handed the old object and the new object. It isn&#x27;t given an event type. It gets a key, a namespace and a name, and nothing else. It&#x27;s minimal by design, because it has to work for many different controllers. The function&#x27;s job is to fetch the object with that namespace/name, look at the world, and converge to the desired state.</p><h3 id="edge-triggered-notifications-level-triggered-logic"><a href="https://planetscale.com/blog/the-feedback-loops-behind-kubernetes#edge-triggered-notifications-level-triggered-logic">Edge-triggered notifications, level-triggered logic</a></h3><p>There are two ways to build any closed feedback loop:</p><ul><li><strong>Edge-triggered</strong>: act on transitions, on events. &quot;The disk crossed 80%.&quot; &quot;The Pod was deleted.&quot; &quot;The number of replicas increased by 2.&quot;</li><li><strong>Level-triggered</strong>: act on the current state, regardless of how you got there. &quot;The disk <em>is</em> at 85%.&quot; &quot;The Pod <em>is</em> missing.&quot; &quot;The number of replicas is 3.&quot;</li></ul><p>My first mental model of controllers, and probably yours at some point, was edge-triggered: listen to a stream of changes, and for each change, try to converge.</p><p>The problem is that this is very fragile. In distributed systems, if one component is fragile, the fragility spreads to the rest of the system. Why is edge-triggering fragile? Say your controller is down for thirty seconds. It misses the events from those thirty seconds, and its view of the world is now permanently wrong. If two events arrive out of order, you process them out of order. If an event is delivered twice, you act twice. You&#x27;re rebuilding your state from a stream of events, and you&#x27;ve inherited all of event sourcing&#x27;s hard problems.</p><p>Here is a very concrete example. Assume you have 1 replica, and you increase it to 3 replicas. Because you have only subscribed to changes, either:</p><ol><li>You miss the event (maybe the queue dropped it, or the consumer, your app, dropped it due to a crash or a full buffer).</li><li>You receive it twice.</li></ol><p>In the first case, you won&#x27;t be able to self-correct. In the second case, if your handler blindly applies the delta again, you&#x27;ll end up with 5 replicas (you overshoot), instead of 3.</p><p>The level-triggered model fixes all of that. Remember, our shell script never asked &quot;what changed?&quot; It asked &quot;what <em>is</em> true right now?&quot;, every five seconds, from scratch. Miss a loop, and the next one catches up. Run the loop twice, and you get the same result. The current state of the world is the only input that matters, and it&#x27;s always available to read. So in the level-triggered case, our example above becomes this: you read <code>replicas=3</code>, you check the current number of replicas, which is 1, and you increase by 2.</p><p>If you miss the event, no one cares. In the next reconcile loop you&#x27;ll catch it. If your app crashes, it comes back, reads again and detects that it did not increase it yet, increases it.</p><p>Kubernetes controllers combine both: <strong>edge-triggered notifications, level-triggered logic</strong>.</p><p>Events (the edges) are only a hint that it&#x27;s worth looking again. They tell you <em>when</em> to reconcile, never <em>what</em> to do. The reconcile itself is level-based: it reads the current state (e.g., <code>replicas=3</code>) and drives toward the desired state (e.g., <code>create 2 replicas</code>), ignoring the triggering event completely. That&#x27;s <em>why</em> <code>Reconcile</code> only gets a key. The framework makes it hard to write edge-triggered logic, on purpose. Edge-triggered logic is how you get a controller that&#x27;s fragile and permanently wrong after its first hiccup.</p><p><picture class="block"><source media="(prefers-color-scheme: light), (prefers-color-scheme: no-preference)" srcSet="https://planetscale-images.imgix.net/assets/part2-edge-vs-level-BUiD8D-7.png?auto=compress%2Cformat"><source media="(prefers-color-scheme: dark)" srcSet="https://planetscale-images.imgix.net/assets/part2-edge-vs-level-darkmode-3DNb92aw.png?auto=compress%2Cformat"><img alt="Edge-triggered versus level-triggered scaling" src="https://planetscale-images.imgix.net/assets/part2-edge-vs-level-BUiD8D-7.png?auto=compress%2Cformat" width="1504" height="927" loading="lazy"></picture></p><p>Our bash script stumbled into this property by accident, at least for the sake of the example. But the <code>controller-runtime</code> framework gives it to you on purpose. It&#x27;s why a Kubernetes controller can crash, get restarted ten minutes later, and converge correctly with no special recovery code. There is no recovery code. There is just the loop. The controller can reconstruct the world from scratch.</p><h3 id="informers-the-work-queue-and-a-cache"><a href="https://planetscale.com/blog/the-feedback-loops-behind-kubernetes#informers-the-work-queue-and-a-cache">Informers, the work queue, and a cache</a></h3><p>So where do the edges come from? And what stops a controller from DDoSing the API server by listing everything every five seconds like my script did?</p><p>The answer is the <strong>informer</strong>. An informer opens a single watch against the API server for a given resource type, streams every add, update, and delete, and keeps a complete in-memory <strong>cache</strong> of the objects we&#x27;re interested in. Two things matter here:</p><p>First, the informer turns each watch event into a key and puts it on a <strong>work queue</strong>. The queue does a lot of work for you.</p><ul><li>It <em>coalesces</em>: if the same object is updated five times before you get to it, you reconcile it once, against the latest state (level-triggered again).</li><li>It <em>rate-limits</em>: an object that keeps erroring backs off exponentially instead of spinning. This is <a href="https://en.wikipedia.org/wiki/Damping">damping</a>, the same reason a crash-looping container backs off instead of restarting hot.</li><li>It lets you run a pool of workers pulling keys in parallel, which is your fan-out. Events fan in from the watch, collapse in the queue, and fan out to the workers. This is something you need to tune. The higher you set the pool, the more pressure you put on the system: more writes, more API calls, more load on the provider, and more CPU usage in the operator.</li></ul><p><picture class="block"><source media="(prefers-color-scheme: light), (prefers-color-scheme: no-preference)" srcSet="https://planetscale-images.imgix.net/assets/part2-informer-queue-yyOXLWWC.png?auto=compress%2Cformat"><source media="(prefers-color-scheme: dark)" srcSet="https://planetscale-images.imgix.net/assets/part2-informer-queue-darkmode-ANBXf_4R.png?auto=compress%2Cformat"><img alt="Informer, work queue, and controller diagram" src="https://planetscale-images.imgix.net/assets/part2-informer-queue-yyOXLWWC.png?auto=compress%2Cformat" width="1504" height="1007" loading="lazy"></picture></p><p>Second, and this is a detail that bites people a lot: <strong>your reads and your writes in Kubernetes don&#x27;t go to the same place.</strong></p><p>In controller-runtime, the client you&#x27;re handed reads from the informer&#x27;s local cache. Cache reads are cheap, they don&#x27;t touch the API server, and that&#x27;s how a controller reconciles thousands of objects without falling over. But your writes go straight to the API server. The cache only learns about your write when the resulting watch event comes back around, a moment later.</p><p>Because of that, a read can be stale. You need to be prepared for this.</p><p>If you write a field of an object and then read the same object again from the cache, the reconciler might think it&#x27;s not updated yet. You write again, and you get a Conflict error. Retrying with a fresh read can be fine, but blindly retrying against the same stale cached view just spins.</p><p>Most of the time, what you want is to drop the call and <em>requeue</em>. In the next reconcile, the <code>GET</code> will see the updated object, and your write will never happen. That&#x27;s how everything self-converges.</p><p>Here is another edge case. Picture this sequence inside a reconcile:</p><div class="code-block" data-language="go"><div class="min-w-0 max-w-full"><pre class="shiki shiki-themes planetscale-light planetscale-dark" style="--shiki-light:#2b2b2b;--shiki-dark:#e1e1e1;--shiki-light-bg:#ebebeb;--shiki-dark-bg:#1a1a1a" tabindex="0"><code><span class="line"><span style="--shiki-light:#818181;--shiki-dark:#A1A1A1">// I want N replicas. I see fewer, so I create the missing ones.</span></span>
<span class="line"><span style="--shiki-light:#A78103;--shiki-dark:#F2B600">existing</span><span style="--shiki-light:#616161;--shiki-dark:#C1C1C1">,</span><span style="--shiki-light:#A78103;--shiki-dark:#F2B600"> _</span><span style="--shiki-light:#F35815;--shiki-dark:#F35815"> :=</span><span style="--shiki-light:#A78103;--shiki-dark:#F2B600"> r</span><span style="--shiki-light:#616161;--shiki-dark:#C1C1C1">.</span><span style="--shiki-light:#5E49AF;--shiki-dark:#B7A5FB">listChildPods</span><span style="--shiki-light:#616161;--shiki-dark:#C1C1C1">(</span><span style="--shiki-light:#A78103;--shiki-dark:#F2B600">ctx</span><span style="--shiki-light:#616161;--shiki-dark:#C1C1C1">)</span><span style="--shiki-light:#818181;--shiki-dark:#A1A1A1">        // reads the CACHE</span></span>
<span class="line"><span style="--shiki-light:#F35815;--shiki-dark:#F35815">for</span><span style="--shiki-light:#A78103;--shiki-dark:#F2B600"> i</span><span style="--shiki-light:#F35815;--shiki-dark:#F35815"> :=</span><span style="--shiki-light:#5E49AF;--shiki-dark:#B7A5FB"> len</span><span style="--shiki-light:#616161;--shiki-dark:#C1C1C1">(</span><span style="--shiki-light:#A78103;--shiki-dark:#F2B600">existing</span><span style="--shiki-light:#616161;--shiki-dark:#C1C1C1">);</span><span style="--shiki-light:#A78103;--shiki-dark:#F2B600"> i</span><span style="--shiki-light:#F35815;--shiki-dark:#F35815"> &#x3C;</span><span style="--shiki-light:#A78103;--shiki-dark:#F2B600"> desired</span><span style="--shiki-light:#616161;--shiki-dark:#C1C1C1">;</span><span style="--shiki-light:#A78103;--shiki-dark:#F2B600"> i</span><span style="--shiki-light:#F35815;--shiki-dark:#F35815">++</span><span style="--shiki-light:#616161;--shiki-dark:#C1C1C1"> {</span></span>
<span class="line"><span style="--shiki-light:#A78103;--shiki-dark:#F2B600">    r</span><span style="--shiki-light:#616161;--shiki-dark:#C1C1C1">.</span><span style="--shiki-light:#A78103;--shiki-dark:#F2B600">client</span><span style="--shiki-light:#616161;--shiki-dark:#C1C1C1">.</span><span style="--shiki-light:#5E49AF;--shiki-dark:#B7A5FB">Create</span><span style="--shiki-light:#616161;--shiki-dark:#C1C1C1">(</span><span style="--shiki-light:#A78103;--shiki-dark:#F2B600">ctx</span><span style="--shiki-light:#616161;--shiki-dark:#C1C1C1">,</span><span style="--shiki-light:#5E49AF;--shiki-dark:#B7A5FB"> newPod</span><span style="--shiki-light:#616161;--shiki-dark:#C1C1C1">(</span><span style="--shiki-light:#A78103;--shiki-dark:#F2B600">i</span><span style="--shiki-light:#616161;--shiki-dark:#C1C1C1">))</span><span style="--shiki-light:#818181;--shiki-dark:#A1A1A1">          // writes the API SERVER</span></span>
<span class="line"><span style="--shiki-light:#616161;--shiki-dark:#C1C1C1">}</span></span>
<span class="line"></span></code></pre></div></div><p>Now an event fires again a second later, before the cache has caught up with the Pods you just created. You list from the cache, and the new Pods aren&#x27;t there yet. Your code decides it still needs to create them, and you create duplicates. This is the classic stale-cache double-create, and it&#x27;s nasty because it only shows up under timing you can&#x27;t reproduce on your laptop.</p><p><picture class="block"><source media="(prefers-color-scheme: light), (prefers-color-scheme: no-preference)" srcSet="https://planetscale-images.imgix.net/assets/part2-cache-vs-api-4EYpZbTb.png?auto=compress%2Cformat"><source media="(prefers-color-scheme: dark)" srcSet="https://planetscale-images.imgix.net/assets/part2-cache-vs-api-darkmode-9mbMAIBr.png?auto=compress%2Cformat"><img alt="Kubernetes cache reads versus API writes diagram" src="https://planetscale-images.imgix.net/assets/part2-cache-vs-api-4EYpZbTb.png?auto=compress%2Cformat" width="1504" height="1071" loading="lazy"></picture></p><p>There are two ways out. The correct one is the <strong>expectations pattern</strong>, the same trick the built-in ReplicaSet controller uses: you record that you expect to see N creations in memory, and you don&#x27;t act again until the cache has caught up to your own writes. It works, but it&#x27;s not easy to implement and it&#x27;s a fair amount of machinery. Read more <a href="https://ahmet.im/blog/controller-pitfalls/">on Ahmet&#x27;s blog</a>.</p><p>The pragmatic one, which a lot of people use, is to bypass the cache for the reads where a stale view would cause a double-create or double-delete, and go straight to the API server:</p><div class="code-block" data-language="go"><div class="min-w-0 max-w-full"><pre class="shiki shiki-themes planetscale-light planetscale-dark" style="--shiki-light:#2b2b2b;--shiki-dark:#e1e1e1;--shiki-light-bg:#ebebeb;--shiki-dark-bg:#1a1a1a" tabindex="0"><code><span class="line"><span style="--shiki-light:#818181;--shiki-dark:#A1A1A1">// The cached client can be stale right after our own writes, which</span></span>
<span class="line"><span style="--shiki-light:#818181;--shiki-dark:#A1A1A1">// would make us miscount and create duplicates. For this one read,</span></span>
<span class="line"><span style="--shiki-light:#818181;--shiki-dark:#A1A1A1">// go direct to the API server instead of the cache. Slower,</span></span>
<span class="line"><span style="--shiki-light:#818181;--shiki-dark:#A1A1A1">// but consistent for this decision.</span></span>
<span class="line"><span style="--shiki-light:#A78103;--shiki-dark:#F2B600">err</span><span style="--shiki-light:#F35815;--shiki-dark:#F35815"> :=</span><span style="--shiki-light:#A78103;--shiki-dark:#F2B600"> r</span><span style="--shiki-light:#616161;--shiki-dark:#C1C1C1">.</span><span style="--shiki-light:#A78103;--shiki-dark:#F2B600">apiReader</span><span style="--shiki-light:#616161;--shiki-dark:#C1C1C1">.</span><span style="--shiki-light:#5E49AF;--shiki-dark:#B7A5FB">List</span><span style="--shiki-light:#616161;--shiki-dark:#C1C1C1">(</span><span style="--shiki-light:#A78103;--shiki-dark:#F2B600">ctx</span><span style="--shiki-light:#616161;--shiki-dark:#C1C1C1">,</span><span style="--shiki-light:#F35815;--shiki-dark:#F35815"> &#x26;</span><span style="--shiki-light:#A78103;--shiki-dark:#F2B600">instances</span><span style="--shiki-light:#616161;--shiki-dark:#C1C1C1">,</span><span style="--shiki-light:#A78103;--shiki-dark:#F2B600"> client</span><span style="--shiki-light:#616161;--shiki-dark:#C1C1C1">.</span><span style="--shiki-light:#5E49AF;--shiki-dark:#B7A5FB">InNamespace</span><span style="--shiki-light:#616161;--shiki-dark:#C1C1C1">(</span><span style="--shiki-light:#A78103;--shiki-dark:#F2B600">ns</span><span style="--shiki-light:#616161;--shiki-dark:#C1C1C1">),</span><span style="--shiki-light:#A78103;--shiki-dark:#F2B600"> labelSelector</span><span style="--shiki-light:#616161;--shiki-dark:#C1C1C1">)</span></span>
<span class="line"></span></code></pre></div></div><p>This is not only a Kubernetes issue. In any system with a read cache and a write-through path, read-after-write is not consistent unless you make it so. Most of the time the cache is exactly what you want: cheap, local, and eventually consistent. Eventual consistency is fine because the loop runs again. But the moment a decision would be destructive or non-idempotent if you acted on a stale read, you need to know which path you&#x27;re on. Kubernetes solves many hard problems, but it also gives you a few new ones.</p><h3 id="setpoint-and-measured-variable-spec-and-status"><a href="https://planetscale.com/blog/the-feedback-loops-behind-kubernetes#setpoint-and-measured-variable-spec-and-status">Setpoint and measured variable: spec and status</a></h3><p>Back to the control diagram. My script kept its setpoint in shell variables and its measured state in the output of <code>df</code> and <code>psql</code>. Kubernetes gives both a permanent home, on the object itself.</p><p><code>.spec</code> is the <strong>setpoint</strong>, the desired state. It&#x27;s owned by whoever created the object (a human, or another controller), and the reconciler treats it as read-only intent. It&#x27;s an anti-pattern to write to the <code>.spec</code> from inside the controller. If you do it, stop reading, go and fix your codebase. There are only a handful of exceptions, but a controller should generally never set its own setpoint.</p><p><code>.status</code> is the <strong>measured variable</strong>, the observed state. It&#x27;s owned by the controller, written through a separate status subresource, and it&#x27;s where you record what&#x27;s actually true. The better the status, the better the controller can decide. A good <code>.status</code> field is what makes a controller pleasant to operate. The word <em>observability</em> comes from control theory; <a href="https://en.wikipedia.org/wiki/Observability">Kalman coined it</a> around 1960 to ask whether you can infer a system&#x27;s internal state from its outputs. <code>.status</code> is also your response to any third-party system. If someone wants to learn the outcome of your actions, <code>.status</code> is the place to look at.</p><p>That split is the whole declarative model in two fields. It comes with a piece of bookkeeping that&#x27;s pure control theory: <code>.metadata.generation</code> increments when desired state changes, and by convention the controller writes back <code>.status.observedGeneration</code> to say &quot;the state I&#x27;m reporting reflects this version of your intent.&quot;</p><p>When <code>observedGeneration &lt; generation</code>, the status you&#x27;re looking at does not reflect the latest setpoint yet. That one comparison is how you tell &quot;converged&quot; from &quot;still working on it.&quot;</p><p><picture class="block"><source media="(prefers-color-scheme: light), (prefers-color-scheme: no-preference)" srcSet="https://planetscale-images.imgix.net/assets/part2-spec-status-CinHPict.png?auto=compress%2Cformat"><source media="(prefers-color-scheme: dark)" srcSet="https://planetscale-images.imgix.net/assets/part2-spec-status-darkmode-DI9X1oFB.png?auto=compress%2Cformat"><img alt="Spec and status as setpoint and measured variable" src="https://planetscale-images.imgix.net/assets/part2-spec-status-CinHPict.png?auto=compress%2Cformat" width="1504" height="1007" loading="lazy"></picture></p><p>This is why the reconcile is <strong>stateless</strong>, and why that matters. Our shell script kept &quot;am I mid-failover?&quot; in a variable that died with the process. A Kubernetes controller keeps nothing important in memory. Every fact it needs is on an API object: the spec it&#x27;s driving toward, the status it last observed, the conditions describing where things stand. Kill the controller, restart it on another node, and it picks up exactly where it left off, not because it saved its progress, but because there was never any in-memory progress to lose. The state lives in the cluster (API server, <code>etcd</code> is what holds the state). The controller is just the loop that reads it.</p><h3 id="self-healing-by-design"><a href="https://planetscale.com/blog/the-feedback-loops-behind-kubernetes#self-healing-by-design">Self-healing by design</a></h3><p>This is the part I like most.</p><p>When a controller creates a child object (a Pod, a PVC), it stamps an <strong>ownerReference</strong> on the child pointing back at the parent. That reference does two things. It sets up garbage collection: delete the parent, and Kubernetes can cascade the delete to its children. And it gives the controller a way to map child changes back to the parent: &quot;when any object I own changes, enqueue my parent for a reconcile.&quot; <code>ownerReference</code> allows you to link controllers to each other and create chains. If done right, all your controllers and systems fit together.</p><p>Here is an example. Follow the loop:</p><ol><li>A node dies and takes a Pod with it.</li><li>The Pod&#x27;s deletion is a watch event, an edge.</li><li>Through the ownership link, that edge becomes a reconcile request for the parent.</li><li>The parent reconciles, observes its children (level-triggered), sees one is missing and the count is below the setpoint, and creates a replacement.</li><li>The replacement is an unscheduled Pod, an edge for the scheduler.</li><li>The scheduler detects the unscheduled Pod, assigns a node.</li><li>The kubelet gets triggered because that&#x27;s an edge for that node&#x27;s kubelet and it starts the container.</li></ol><p>That&#x27;s multiple feedback loops, each watching the layer below, each reacting to an edge and converging to its own level, chained together through the API server with nobody orchestrating the whole thing.</p><p>Control theory has a name for loops stacked like this: <a href="https://en.wikipedia.org/wiki/Proportional%E2%80%93integral%E2%80%93derivative_controller#Cascade_control"><strong>cascade control</strong></a>. The output of an outer loop becomes the setpoint of an inner loop. A controller never writes its own <code>.spec</code>, but it writes <em>other</em> objects&#x27; <code>.spec</code> all the time. My operator writes the PVC&#x27;s spec, and that spec is the setpoint the CSI controllers converge to. Each loop worries only about its own layer and trusts the loop below.</p><p>So we wrote <code>if ! pg_isready; then docker start; fi</code> and maybe thought we&#x27;re good. Kubernetes turns that one line into several independent controllers that have never heard of each other, but still cooperate because they share the API server and watch each other&#x27;s objects. I like this part a lot. Nobody calls a central orchestrator. Nobody passes a private message. The system heals itself.</p><h3 id="what-observe-actually-means-in-a-real-operator"><a href="https://planetscale.com/blog/the-feedback-loops-behind-kubernetes#what-observe-actually-means-in-a-real-operator">What &quot;observe&quot; actually means in a real operator</a></h3><p>Up to here I&#x27;ve been a little vague about the &quot;measure&quot; step, because in the examples the measured state is just &quot;list the child Pods.&quot; But in a real database operator it&#x27;s a lot more than that.</p><p>When an operator I work on reconciles a single Postgres instance, the first thing it does, before it decides anything, is build a snapshot of reality from every source that knows something true about that instance. Not just Kubernetes. Kubernetes barely knows anything about whether Postgres is actually healthy.</p><p>The sources gathered at the top of every reconcile:</p><ul><li><strong>The Kubernetes cache</strong>: the Pod, its PVC, the PV behind it, the Node it&#x27;s on, the ConfigMap holding its config. These are the cheap local reads, the stuff we already talked about.</li><li><strong>The database&#x27;s effective configuration.</strong> Not what we last wrote down, but what the server has actually loaded, so we can compare the two and detect drift. Other entities can rewrite or reload the config on disk without us knowing, so the only honest source of truth is the running server itself, never our last write.</li><li><strong>The database&#x27;s own view of its health.</strong> Its role, whether it&#x27;s healthy, how far behind its followers are, whether it&#x27;s currently accepting writes. Some of this comes from the agents that sit next to the database and manage it; some we get by opening a connection and asking the database directly. These calls carry a tight timeout and are allowed to fail, more on that below.</li><li><strong>A background collector.</strong> Some signals are too expensive or too rate-limited to fetch on every reconcile: disk usage, or whether a volume operation we kicked off earlier is still in flight and where it sits in its cooldown window. A separate collector, often a background goroutine, gathers these on a slow cadence and keeps the last value per volume in memory. The reconcile reads that value instantly, without blocking on anything. Think of these as custom workqueues you implement.</li></ul><p><picture class="block"><source media="(prefers-color-scheme: light), (prefers-color-scheme: no-preference)" srcSet="https://planetscale-images.imgix.net/assets/part2-observation-fan-in-DvyJkB0Y.png?auto=compress%2Cformat"><source media="(prefers-color-scheme: dark)" srcSet="https://planetscale-images.imgix.net/assets/part2-observation-fan-in-darkmode-KuH1rwY1.png?auto=compress%2Cformat"><img alt="Observation fan-in for a reconciler" src="https://planetscale-images.imgix.net/assets/part2-observation-fan-in-DvyJkB0Y.png?auto=compress%2Cformat" width="1504" height="1007" loading="lazy"></picture></p><p>In code, the snapshot is just a struct, and the reconcile&#x27;s first move is to populate it. This is simplified, but faithful to the real shape:</p><div class="code-block" data-language="go"><div class="min-w-0 max-w-full"><pre class="shiki shiki-themes planetscale-light planetscale-dark" style="--shiki-light:#2b2b2b;--shiki-dark:#e1e1e1;--shiki-light-bg:#ebebeb;--shiki-dark-bg:#1a1a1a" tabindex="0"><code><span class="line"><span style="--shiki-light:#818181;--shiki-dark:#A1A1A1">// The observation snapshot: everything we know about this instance, right now.</span></span>
<span class="line"><span style="--shiki-light:#F35815;--shiki-dark:#F35815">type</span><span style="--shiki-light:#F35815;--shiki-dark:#F35815"> reconcileHandler</span><span style="--shiki-light:#F35815;--shiki-dark:#F35815"> struct</span><span style="--shiki-light:#616161;--shiki-dark:#C1C1C1"> {</span></span>
<span class="line"><span style="--shiki-light:#818181;--shiki-dark:#A1A1A1">    // The object (.spec = setpoint, .status = measured).</span></span>
<span class="line"><span style="--shiki-light:#A78103;--shiki-dark:#F2B600">    instance</span><span style="--shiki-light:#F35815;--shiki-dark:#F35815"> *v1</span><span style="--shiki-light:#616161;--shiki-dark:#C1C1C1">.</span><span style="--shiki-light:#F35815;--shiki-dark:#F35815">PostgresInstance</span></span>
<span class="line"></span>
<span class="line"><span style="--shiki-light:#818181;--shiki-dark:#A1A1A1">    // Kubernetes objects.</span></span>
<span class="line"><span style="--shiki-light:#A78103;--shiki-dark:#F2B600">    pod</span><span style="--shiki-light:#F35815;--shiki-dark:#F35815">  *corev1</span><span style="--shiki-light:#616161;--shiki-dark:#C1C1C1">.</span><span style="--shiki-light:#F35815;--shiki-dark:#F35815">Pod</span></span>
<span class="line"><span style="--shiki-light:#A78103;--shiki-dark:#F2B600">    pvc</span><span style="--shiki-light:#F35815;--shiki-dark:#F35815">  *corev1</span><span style="--shiki-light:#616161;--shiki-dark:#C1C1C1">.</span><span style="--shiki-light:#F35815;--shiki-dark:#F35815">PersistentVolumeClaim</span></span>
<span class="line"><span style="--shiki-light:#A78103;--shiki-dark:#F2B600">    node</span><span style="--shiki-light:#F35815;--shiki-dark:#F35815"> *corev1</span><span style="--shiki-light:#616161;--shiki-dark:#C1C1C1">.</span><span style="--shiki-light:#F35815;--shiki-dark:#F35815">Node</span></span>
<span class="line"></span>
<span class="line"><span style="--shiki-light:#818181;--shiki-dark:#A1A1A1">    // Database state.</span></span>
<span class="line"><span style="--shiki-light:#A78103;--shiki-dark:#F2B600">    dbState</span><span style="--shiki-light:#F35815;--shiki-dark:#F35815"> DatabaseState</span></span>
<span class="line"></span>
<span class="line"><span style="--shiki-light:#818181;--shiki-dark:#A1A1A1">    // What Postgres actually loaded, not what we last wrote.</span></span>
<span class="line"><span style="--shiki-light:#A78103;--shiki-dark:#F2B600">    effectiveConfig</span><span style="--shiki-light:#F35815;--shiki-dark:#F35815"> map</span><span style="--shiki-light:#616161;--shiki-dark:#C1C1C1">[</span><span style="--shiki-light:#F35815;--shiki-dark:#F35815">string</span><span style="--shiki-light:#616161;--shiki-dark:#C1C1C1">]</span><span style="--shiki-light:#F35815;--shiki-dark:#F35815">string</span></span>
<span class="line"></span>
<span class="line"><span style="--shiki-light:#818181;--shiki-dark:#A1A1A1">    // Collected out-of-band.</span></span>
<span class="line"><span style="--shiki-light:#A78103;--shiki-dark:#F2B600">    diskUsage</span><span style="--shiki-light:#F35815;--shiki-dark:#F35815"> *resource</span><span style="--shiki-light:#616161;--shiki-dark:#C1C1C1">.</span><span style="--shiki-light:#F35815;--shiki-dark:#F35815">Quantity</span></span>
<span class="line"></span>
<span class="line"><span style="--shiki-light:#818181;--shiki-dark:#A1A1A1">    // The volume operation already in flight, if any.</span></span>
<span class="line"><span style="--shiki-light:#A78103;--shiki-dark:#F2B600">    storageOp</span><span style="--shiki-light:#F35815;--shiki-dark:#F35815"> *StorageOperation</span></span>
<span class="line"><span style="--shiki-light:#616161;--shiki-dark:#C1C1C1">}</span></span>
<span class="line"></span>
<span class="line"><span style="--shiki-light:#F35815;--shiki-dark:#F35815">func</span><span style="--shiki-light:#616161;--shiki-dark:#C1C1C1"> (</span><span style="--shiki-light:#A78103;--shiki-dark:#F2B600">r </span><span style="--shiki-light:#F35815;--shiki-dark:#F35815">*Reconciler</span><span style="--shiki-light:#616161;--shiki-dark:#C1C1C1">)</span><span style="--shiki-light:#5E49AF;--shiki-dark:#B7A5FB"> newReconcileHandler</span><span style="--shiki-light:#616161;--shiki-dark:#C1C1C1">(</span></span>
<span class="line"><span style="--shiki-light:#A78103;--shiki-dark:#F2B600">  ctx</span><span style="--shiki-light:#F35815;--shiki-dark:#F35815"> context</span><span style="--shiki-light:#616161;--shiki-dark:#C1C1C1">.</span><span style="--shiki-light:#F35815;--shiki-dark:#F35815">Context</span><span style="--shiki-light:#616161;--shiki-dark:#C1C1C1">,</span></span>
<span class="line"><span style="--shiki-light:#A78103;--shiki-dark:#F2B600">  inst</span><span style="--shiki-light:#F35815;--shiki-dark:#F35815"> *v1</span><span style="--shiki-light:#616161;--shiki-dark:#C1C1C1">.</span><span style="--shiki-light:#F35815;--shiki-dark:#F35815">PostgresInstance</span><span style="--shiki-light:#616161;--shiki-dark:#C1C1C1">,</span></span>
<span class="line"><span style="--shiki-light:#616161;--shiki-dark:#C1C1C1">)</span><span style="--shiki-light:#616161;--shiki-dark:#C1C1C1"> (</span><span style="--shiki-light:#F35815;--shiki-dark:#F35815">*reconcileHandler</span><span style="--shiki-light:#616161;--shiki-dark:#C1C1C1">,</span><span style="--shiki-light:#F35815;--shiki-dark:#F35815"> error</span><span style="--shiki-light:#616161;--shiki-dark:#C1C1C1">)</span><span style="--shiki-light:#616161;--shiki-dark:#C1C1C1"> {</span></span>
<span class="line"><span style="--shiki-light:#A78103;--shiki-dark:#F2B600">    h</span><span style="--shiki-light:#F35815;--shiki-dark:#F35815"> :=</span><span style="--shiki-light:#F35815;--shiki-dark:#F35815"> &#x26;reconcileHandler</span><span style="--shiki-light:#616161;--shiki-dark:#C1C1C1">{</span><span style="--shiki-light:#A78103;--shiki-dark:#F2B600">instance</span><span style="--shiki-light:#616161;--shiki-dark:#C1C1C1">:</span><span style="--shiki-light:#A78103;--shiki-dark:#F2B600"> inst</span><span style="--shiki-light:#616161;--shiki-dark:#C1C1C1">}</span></span>
<span class="line"></span>
<span class="line"><span style="--shiki-light:#818181;--shiki-dark:#A1A1A1">    // Cheap local reads.</span></span>
<span class="line"><span style="--shiki-light:#A78103;--shiki-dark:#F2B600">    h</span><span style="--shiki-light:#616161;--shiki-dark:#C1C1C1">.</span><span style="--shiki-light:#A78103;--shiki-dark:#F2B600">pod</span><span style="--shiki-light:#616161;--shiki-dark:#C1C1C1">,</span><span style="--shiki-light:#A78103;--shiki-dark:#F2B600"> h</span><span style="--shiki-light:#616161;--shiki-dark:#C1C1C1">.</span><span style="--shiki-light:#A78103;--shiki-dark:#F2B600">pvc</span><span style="--shiki-light:#616161;--shiki-dark:#C1C1C1">,</span><span style="--shiki-light:#A78103;--shiki-dark:#F2B600"> h</span><span style="--shiki-light:#616161;--shiki-dark:#C1C1C1">.</span><span style="--shiki-light:#A78103;--shiki-dark:#F2B600">node</span><span style="--shiki-light:#F35815;--shiki-dark:#F35815"> =</span><span style="--shiki-light:#A78103;--shiki-dark:#F2B600"> r</span><span style="--shiki-light:#616161;--shiki-dark:#C1C1C1">.</span><span style="--shiki-light:#5E49AF;--shiki-dark:#B7A5FB">fetchKubeObjects</span><span style="--shiki-light:#616161;--shiki-dark:#C1C1C1">(</span><span style="--shiki-light:#A78103;--shiki-dark:#F2B600">ctx</span><span style="--shiki-light:#616161;--shiki-dark:#C1C1C1">,</span><span style="--shiki-light:#A78103;--shiki-dark:#F2B600"> inst</span><span style="--shiki-light:#616161;--shiki-dark:#C1C1C1">)</span></span>
<span class="line"></span>
<span class="line"><span style="--shiki-light:#818181;--shiki-dark:#A1A1A1">    // Active database calls.</span></span>
<span class="line"><span style="--shiki-light:#A78103;--shiki-dark:#F2B600">    h</span><span style="--shiki-light:#616161;--shiki-dark:#C1C1C1">.</span><span style="--shiki-light:#A78103;--shiki-dark:#F2B600">dbState</span><span style="--shiki-light:#F35815;--shiki-dark:#F35815">         =</span><span style="--shiki-light:#A78103;--shiki-dark:#F2B600"> r</span><span style="--shiki-light:#616161;--shiki-dark:#C1C1C1">.</span><span style="--shiki-light:#5E49AF;--shiki-dark:#B7A5FB">queryDatabase</span><span style="--shiki-light:#616161;--shiki-dark:#C1C1C1">(</span><span style="--shiki-light:#A78103;--shiki-dark:#F2B600">ctx</span><span style="--shiki-light:#616161;--shiki-dark:#C1C1C1">,</span><span style="--shiki-light:#A78103;--shiki-dark:#F2B600"> h</span><span style="--shiki-light:#616161;--shiki-dark:#C1C1C1">.</span><span style="--shiki-light:#A78103;--shiki-dark:#F2B600">pod</span><span style="--shiki-light:#616161;--shiki-dark:#C1C1C1">)</span></span>
<span class="line"><span style="--shiki-light:#A78103;--shiki-dark:#F2B600">    h</span><span style="--shiki-light:#616161;--shiki-dark:#C1C1C1">.</span><span style="--shiki-light:#A78103;--shiki-dark:#F2B600">effectiveConfig</span><span style="--shiki-light:#F35815;--shiki-dark:#F35815"> =</span><span style="--shiki-light:#A78103;--shiki-dark:#F2B600"> r</span><span style="--shiki-light:#616161;--shiki-dark:#C1C1C1">.</span><span style="--shiki-light:#5E49AF;--shiki-dark:#B7A5FB">readEffectiveConfig</span><span style="--shiki-light:#616161;--shiki-dark:#C1C1C1">(</span><span style="--shiki-light:#A78103;--shiki-dark:#F2B600">ctx</span><span style="--shiki-light:#616161;--shiki-dark:#C1C1C1">,</span><span style="--shiki-light:#A78103;--shiki-dark:#F2B600"> h</span><span style="--shiki-light:#616161;--shiki-dark:#C1C1C1">.</span><span style="--shiki-light:#A78103;--shiki-dark:#F2B600">pod</span><span style="--shiki-light:#616161;--shiki-dark:#C1C1C1">)</span></span>
<span class="line"></span>
<span class="line"><span style="--shiki-light:#818181;--shiki-dark:#A1A1A1">    // Values from the collector/metric.</span></span>
<span class="line"><span style="--shiki-light:#A78103;--shiki-dark:#F2B600">    h</span><span style="--shiki-light:#616161;--shiki-dark:#C1C1C1">.</span><span style="--shiki-light:#A78103;--shiki-dark:#F2B600">diskUsage</span><span style="--shiki-light:#F35815;--shiki-dark:#F35815"> =</span><span style="--shiki-light:#A78103;--shiki-dark:#F2B600"> r</span><span style="--shiki-light:#616161;--shiki-dark:#C1C1C1">.</span><span style="--shiki-light:#A78103;--shiki-dark:#F2B600">collector</span><span style="--shiki-light:#616161;--shiki-dark:#C1C1C1">.</span><span style="--shiki-light:#5E49AF;--shiki-dark:#B7A5FB">Usage</span><span style="--shiki-light:#616161;--shiki-dark:#C1C1C1">(</span><span style="--shiki-light:#A78103;--shiki-dark:#F2B600">h</span><span style="--shiki-light:#616161;--shiki-dark:#C1C1C1">.</span><span style="--shiki-light:#A78103;--shiki-dark:#F2B600">pvc</span><span style="--shiki-light:#616161;--shiki-dark:#C1C1C1">)</span></span>
<span class="line"><span style="--shiki-light:#A78103;--shiki-dark:#F2B600">    h</span><span style="--shiki-light:#616161;--shiki-dark:#C1C1C1">.</span><span style="--shiki-light:#A78103;--shiki-dark:#F2B600">storageOp</span><span style="--shiki-light:#F35815;--shiki-dark:#F35815"> =</span><span style="--shiki-light:#A78103;--shiki-dark:#F2B600"> r</span><span style="--shiki-light:#616161;--shiki-dark:#C1C1C1">.</span><span style="--shiki-light:#A78103;--shiki-dark:#F2B600">collector</span><span style="--shiki-light:#616161;--shiki-dark:#C1C1C1">.</span><span style="--shiki-light:#5E49AF;--shiki-dark:#B7A5FB">InFlightOp</span><span style="--shiki-light:#616161;--shiki-dark:#C1C1C1">(</span><span style="--shiki-light:#A78103;--shiki-dark:#F2B600">h</span><span style="--shiki-light:#616161;--shiki-dark:#C1C1C1">.</span><span style="--shiki-light:#A78103;--shiki-dark:#F2B600">pvc</span><span style="--shiki-light:#616161;--shiki-dark:#C1C1C1">)</span></span>
<span class="line"></span>
<span class="line"><span style="--shiki-light:#F35815;--shiki-dark:#F35815">    return</span><span style="--shiki-light:#A78103;--shiki-dark:#F2B600"> h</span><span style="--shiki-light:#616161;--shiki-dark:#C1C1C1">,</span><span style="--shiki-light:#7D5903;--shiki-dark:#FED54A"> nil</span></span>
<span class="line"><span style="--shiki-light:#616161;--shiki-dark:#C1C1C1">}</span></span>
<span class="line"></span></code></pre></div></div><p>A few things about this are deliberate, and only look obvious after you&#x27;ve been burned once or twice.</p><p><strong>Gather once, at the top.</strong> Every sub-decision in the reconcile reads from this one snapshot. We don&#x27;t re-query the database in the middle of the loop, or read the disk usage again three functions deep. If we did, different parts of the same reconcile could see different versions of reality. This sounds like a small detail, but it changes the whole design.</p><p>For example, the database might be the leader when we check at the top and a replica by the time another helper checks again. Then you get decisions that are individually reasonable, but wrong together. We have a rule in the codebase against stashing state back onto this handler mid-reconcile to pass between steps, because it reintroduces exactly the inconsistency we gathered the snapshot to avoid. Making the <code>reconcileHandler</code> immutable is one way to enforce that rule in the type system instead of relying on code review.</p><p><strong>Partial failures are tolerated.</strong> Reaching the database can fail while the Kubernetes reads succeed. That&#x27;s not always an error that aborts the reconcile. It&#x27;s a measured fact: &quot;Postgres is currently unreachable.&quot; That itself is something to record in status. A control loop that gives up entirely whenever one sensor is unavailable is a control loop that&#x27;s down a lot. We degrade instead. Think of a car. If the rain sensor for the wipers is broken, the whole car doesn&#x27;t stop. You can still drive, but you need to turn on a few things yourself.</p><p>Once the data snapshot exists, the reconcile is a sequence of small, idempotent steps, each comparing one slice of desired against observed and acting to close the gap:</p><div class="code-block" data-language="go"><div class="min-w-0 max-w-full"><pre class="shiki shiki-themes planetscale-light planetscale-dark" style="--shiki-light:#2b2b2b;--shiki-dark:#e1e1e1;--shiki-light-bg:#ebebeb;--shiki-dark-bg:#1a1a1a" tabindex="0"><code><span class="line"><span style="--shiki-light:#F35815;--shiki-dark:#F35815">func</span><span style="--shiki-light:#616161;--shiki-dark:#C1C1C1"> (</span><span style="--shiki-light:#A78103;--shiki-dark:#F2B600">r </span><span style="--shiki-light:#F35815;--shiki-dark:#F35815">*reconcileHandler</span><span style="--shiki-light:#616161;--shiki-dark:#C1C1C1">)</span><span style="--shiki-light:#5E49AF;--shiki-dark:#B7A5FB"> reconcile</span><span style="--shiki-light:#616161;--shiki-dark:#C1C1C1">(</span><span style="--shiki-light:#A78103;--shiki-dark:#F2B600">ctx</span><span style="--shiki-light:#F35815;--shiki-dark:#F35815"> context</span><span style="--shiki-light:#616161;--shiki-dark:#C1C1C1">.</span><span style="--shiki-light:#F35815;--shiki-dark:#F35815">Context</span><span style="--shiki-light:#616161;--shiki-dark:#C1C1C1">)</span><span style="--shiki-light:#616161;--shiki-dark:#C1C1C1"> (</span><span style="--shiki-light:#F35815;--shiki-dark:#F35815">reconcile</span><span style="--shiki-light:#616161;--shiki-dark:#C1C1C1">.</span><span style="--shiki-light:#F35815;--shiki-dark:#F35815">Result</span><span style="--shiki-light:#616161;--shiki-dark:#C1C1C1">,</span><span style="--shiki-light:#F35815;--shiki-dark:#F35815"> error</span><span style="--shiki-light:#616161;--shiki-dark:#C1C1C1">)</span><span style="--shiki-light:#616161;--shiki-dark:#C1C1C1"> {</span></span>
<span class="line"><span style="--shiki-light:#F35815;--shiki-dark:#F35815">    var</span><span style="--shiki-light:#A78103;--shiki-dark:#F2B600"> rb</span><span style="--shiki-light:#F35815;--shiki-dark:#F35815"> results</span><span style="--shiki-light:#616161;--shiki-dark:#C1C1C1">.</span><span style="--shiki-light:#F35815;--shiki-dark:#F35815">Builder</span></span>
<span class="line"><span style="--shiki-light:#A78103;--shiki-dark:#F2B600">    rb</span><span style="--shiki-light:#616161;--shiki-dark:#C1C1C1">.</span><span style="--shiki-light:#5E49AF;--shiki-dark:#B7A5FB">Merge</span><span style="--shiki-light:#616161;--shiki-dark:#C1C1C1">(</span><span style="--shiki-light:#A78103;--shiki-dark:#F2B600">r</span><span style="--shiki-light:#616161;--shiki-dark:#C1C1C1">.</span><span style="--shiki-light:#5E49AF;--shiki-dark:#B7A5FB">reconcileConfigMap</span><span style="--shiki-light:#616161;--shiki-dark:#C1C1C1">(</span><span style="--shiki-light:#A78103;--shiki-dark:#F2B600">ctx</span><span style="--shiki-light:#616161;--shiki-dark:#C1C1C1">))</span><span style="--shiki-light:#818181;--shiki-dark:#A1A1A1">   // push desired config</span></span>
<span class="line"><span style="--shiki-light:#A78103;--shiki-dark:#F2B600">    rb</span><span style="--shiki-light:#616161;--shiki-dark:#C1C1C1">.</span><span style="--shiki-light:#5E49AF;--shiki-dark:#B7A5FB">Merge</span><span style="--shiki-light:#616161;--shiki-dark:#C1C1C1">(</span><span style="--shiki-light:#A78103;--shiki-dark:#F2B600">r</span><span style="--shiki-light:#616161;--shiki-dark:#C1C1C1">.</span><span style="--shiki-light:#5E49AF;--shiki-dark:#B7A5FB">reconcileDatabase</span><span style="--shiki-light:#616161;--shiki-dark:#C1C1C1">(</span><span style="--shiki-light:#A78103;--shiki-dark:#F2B600">ctx</span><span style="--shiki-light:#616161;--shiki-dark:#C1C1C1">))</span><span style="--shiki-light:#818181;--shiki-dark:#A1A1A1">    // reload/restart if params drifted</span></span>
<span class="line"><span style="--shiki-light:#A78103;--shiki-dark:#F2B600">    rb</span><span style="--shiki-light:#616161;--shiki-dark:#C1C1C1">.</span><span style="--shiki-light:#5E49AF;--shiki-dark:#B7A5FB">Merge</span><span style="--shiki-light:#616161;--shiki-dark:#C1C1C1">(</span><span style="--shiki-light:#A78103;--shiki-dark:#F2B600">r</span><span style="--shiki-light:#616161;--shiki-dark:#C1C1C1">.</span><span style="--shiki-light:#5E49AF;--shiki-dark:#B7A5FB">reconcilePVC</span><span style="--shiki-light:#616161;--shiki-dark:#C1C1C1">(</span><span style="--shiki-light:#A78103;--shiki-dark:#F2B600">ctx</span><span style="--shiki-light:#616161;--shiki-dark:#C1C1C1">))</span><span style="--shiki-light:#818181;--shiki-dark:#A1A1A1">         // grow the disk if needed</span></span>
<span class="line"><span style="--shiki-light:#A78103;--shiki-dark:#F2B600">    rb</span><span style="--shiki-light:#616161;--shiki-dark:#C1C1C1">.</span><span style="--shiki-light:#5E49AF;--shiki-dark:#B7A5FB">Merge</span><span style="--shiki-light:#616161;--shiki-dark:#C1C1C1">(</span><span style="--shiki-light:#A78103;--shiki-dark:#F2B600">r</span><span style="--shiki-light:#616161;--shiki-dark:#C1C1C1">.</span><span style="--shiki-light:#5E49AF;--shiki-dark:#B7A5FB">reconcilePod</span><span style="--shiki-light:#616161;--shiki-dark:#C1C1C1">(</span><span style="--shiki-light:#A78103;--shiki-dark:#F2B600">ctx</span><span style="--shiki-light:#616161;--shiki-dark:#C1C1C1">))</span><span style="--shiki-light:#818181;--shiki-dark:#A1A1A1">         // create/replace the Pod</span></span>
<span class="line"><span style="--shiki-light:#A78103;--shiki-dark:#F2B600">    rb</span><span style="--shiki-light:#616161;--shiki-dark:#C1C1C1">.</span><span style="--shiki-light:#5E49AF;--shiki-dark:#B7A5FB">Merge</span><span style="--shiki-light:#616161;--shiki-dark:#C1C1C1">(</span><span style="--shiki-light:#A78103;--shiki-dark:#F2B600">r</span><span style="--shiki-light:#616161;--shiki-dark:#C1C1C1">.</span><span style="--shiki-light:#5E49AF;--shiki-dark:#B7A5FB">reconcileStatus</span><span style="--shiki-light:#616161;--shiki-dark:#C1C1C1">(</span><span style="--shiki-light:#A78103;--shiki-dark:#F2B600">ctx</span><span style="--shiki-light:#616161;--shiki-dark:#C1C1C1">))</span><span style="--shiki-light:#818181;--shiki-dark:#A1A1A1">      // always last: write what we observed</span></span>
<span class="line"><span style="--shiki-light:#F35815;--shiki-dark:#F35815">    return</span><span style="--shiki-light:#A78103;--shiki-dark:#F2B600"> rb</span><span style="--shiki-light:#616161;--shiki-dark:#C1C1C1">.</span><span style="--shiki-light:#5E49AF;--shiki-dark:#B7A5FB">Result</span><span style="--shiki-light:#616161;--shiki-dark:#C1C1C1">()</span></span>
<span class="line"><span style="--shiki-light:#616161;--shiki-dark:#C1C1C1">}</span></span>
<span class="line"></span></code></pre></div></div><p>Status is written last on purpose, because it&#x27;s the measured variable: you record what&#x27;s true after you&#x27;ve taken your actions and observed the result. Again, in our operators, it&#x27;s not possible to write the status mid-reconcile.</p><p>Each step is independently idempotent. Each returns a result, either &quot;I&#x27;m done&quot; or &quot;requeue me in 30 seconds, I&#x27;m waiting on something,&quot; and the results merge. It reads almost exactly like the body of my shell loop. The difference is that &quot;observe the state&quot; grew from <code>df</code> and <code>pg_isready</code> into a fan-in across multiple systems, and &quot;take an action&quot; grew from <code>ssh</code> into typed, conflict-aware API writes.</p><p>This is the operator. The kubelet, the scheduler, CSI, and CNI are infrastructure we get by using Kubernetes. This loop, with its messy real-world observe step, is the part we actually write and deal with. Because we know how the underlying system works, we can design it without treating Kubernetes like a black box.</p><h3 id="not-every-edge-comes-from-the-api-server"><a href="https://planetscale.com/blog/the-feedback-loops-behind-kubernetes#not-every-edge-comes-from-the-api-server">Not every edge comes from the API server</a></h3><p>There&#x27;s one more piece, and it lets me close a loop from Part 1 that I left deliberately: the disk-usage check.</p><p>My shell script polled <code>df</code> on every node every five seconds. For three nodes, fine. For thousands of databases, you can&#x27;t reconcile every one of them every few seconds just to check a number that rarely changes; you&#x27;d spend all your CPU re-deriving &quot;still at 40%, still at 40%, still at 40%.&quot; This is the level-triggered model&#x27;s one real cost: re-checking everything is correct, but it isn&#x27;t free.</p><p>The fix is to add a sensor that emits its own edges. A background collector polls our metrics pipeline for disk usage on a slow cadence, keeps the last value per volume in memory, and only emits an event when usage crosses a threshold, not while it sits above or below one:</p><div class="code-block" data-language="go"><div class="min-w-0 max-w-full"><pre class="shiki shiki-themes planetscale-light planetscale-dark" style="--shiki-light:#2b2b2b;--shiki-dark:#e1e1e1;--shiki-light-bg:#ebebeb;--shiki-dark-bg:#1a1a1a" tabindex="0"><code><span class="line"><span style="--shiki-light:#818181;--shiki-dark:#A1A1A1">// Edge detection. We fire only on the transition across the threshold,</span></span>
<span class="line"><span style="--shiki-light:#818181;--shiki-dark:#A1A1A1">// not every cycle we happen to be above it. Hovering at 81% is silent;</span></span>
<span class="line"><span style="--shiki-light:#818181;--shiki-dark:#A1A1A1">// crossing 80% upward is an event.</span></span>
<span class="line"><span style="--shiki-light:#A78103;--shiki-dark:#F2B600">crossedUp</span><span style="--shiki-light:#F35815;--shiki-dark:#F35815"> :=</span><span style="--shiki-light:#A78103;--shiki-dark:#F2B600"> previousUsage</span><span style="--shiki-light:#F35815;--shiki-dark:#F35815"> &#x3C;</span><span style="--shiki-light:#A78103;--shiki-dark:#F2B600"> pvc</span><span style="--shiki-light:#616161;--shiki-dark:#C1C1C1">.</span><span style="--shiki-light:#A78103;--shiki-dark:#F2B600">GrowThreshold</span><span style="--shiki-light:#F35815;--shiki-dark:#F35815"> &#x26;&#x26;</span><span style="--shiki-light:#A78103;--shiki-dark:#F2B600"> usage</span><span style="--shiki-light:#F35815;--shiki-dark:#F35815"> >=</span><span style="--shiki-light:#A78103;--shiki-dark:#F2B600"> pvc</span><span style="--shiki-light:#616161;--shiki-dark:#C1C1C1">.</span><span style="--shiki-light:#A78103;--shiki-dark:#F2B600">GrowThreshold</span></span>
<span class="line"><span style="--shiki-light:#F35815;--shiki-dark:#F35815">if</span><span style="--shiki-light:#A78103;--shiki-dark:#F2B600"> crossedUp</span><span style="--shiki-light:#616161;--shiki-dark:#C1C1C1"> {</span></span>
<span class="line"><span style="--shiki-light:#818181;--shiki-dark:#A1A1A1">    // -> generic event -> work queue -> reconcile</span></span>
<span class="line"><span style="--shiki-light:#A78103;--shiki-dark:#F2B600">    relay</span><span style="--shiki-light:#616161;--shiki-dark:#C1C1C1">.</span><span style="--shiki-light:#5E49AF;--shiki-dark:#B7A5FB">Send</span><span style="--shiki-light:#616161;--shiki-dark:#C1C1C1">(</span><span style="--shiki-light:#F35815;--shiki-dark:#F35815">Event</span><span style="--shiki-light:#616161;--shiki-dark:#C1C1C1">{</span><span style="--shiki-light:#A78103;--shiki-dark:#F2B600">Key</span><span style="--shiki-light:#616161;--shiki-dark:#C1C1C1">:</span><span style="--shiki-light:#A78103;--shiki-dark:#F2B600"> pvc</span><span style="--shiki-light:#616161;--shiki-dark:#C1C1C1">.</span><span style="--shiki-light:#A78103;--shiki-dark:#F2B600">Key</span><span style="--shiki-light:#616161;--shiki-dark:#C1C1C1">})</span></span>
<span class="line"><span style="--shiki-light:#616161;--shiki-dark:#C1C1C1">}</span></span>
<span class="line"></span></code></pre></div></div><p>That event goes into the same work queue as the API watch events and triggers a normal reconcile of the affected instance. Same rule as before: the event wakes us up, the reconcile decides from the current state.</p><p>For example, say we have a 10GiB disk and it&#x27;s using 8GiB. The collector saw it cross the threshold, so it wakes the reconciler. The reconciler reads the current usage, sees that it crossed the 80% threshold, and sets a new size on the PVC. After that, CSI handles the rest.</p><p>And because edges can be missed (the collector could be down, an event could be dropped from a full channel), there&#x27;s a <strong>resyncer</strong>: a periodic timer that enqueues every object for reconcile every minute or so, regardless of events. It&#x27;s the safety net. It&#x27;s our <code>sleep 5</code> loop. There&#x27;s also <code>RequeueAfter</code>, which a reconcile returns to say &quot;wake me again in 30 seconds,&quot; the controller&#x27;s way of polling a slow external operation without holding a worker.</p><p>There are two more questions: <strong>how often should the loop run, and who is allowed to run it?</strong> Control theory calls the first one the <em>sampling interval</em>. The rule of thumb: act faster than the thing you&#x27;re tracking changes, but not faster than it can respond. Reconciling a disk that fills over hours every few milliseconds just burns CPU to learn the same thing again.</p><p>So the operator puts boundaries around it.</p><ul><li>A <strong>coalescing delay</strong> handles noisy edge events: a burst of events for one object becomes one reconcile (think of it like a fan-in), not a thousand.</li><li>The <strong>resyncer</strong> is the safety net: every object gets looked at once in a while, even when nothing fires.</li><li>And <strong>leader election</strong> answers the <em>who</em>: only one copy of the operator runs the loop at a time. Two controllers writing to the same database object is not &quot;more reliable.&quot; Even with idempotent controllers, they&#x27;ll be requeueing due to conflicts and consuming unnecessary compute. In theory, a perfectly written controller should tolerate this. In practice, software is rarely perfect, and the safer boundary is worth it.</li></ul><p>To close out Part 2, let me redraw the control loop again. The diagram in Part 1 had a few basic boxes. Now, the same loop represents a closed feedback loop more realistically:</p><p><picture class="block"><source media="(prefers-color-scheme: light), (prefers-color-scheme: no-preference)" srcSet="https://planetscale-images.imgix.net/assets/part2-operator-loop-YZG6qYVG.png?auto=compress%2Cformat"><source media="(prefers-color-scheme: dark)" srcSet="https://planetscale-images.imgix.net/assets/part2-operator-loop-darkmode-jOHBdP3P.png?auto=compress%2Cformat"><img alt="Production operator feedback loop diagram" src="https://planetscale-images.imgix.net/assets/part2-operator-loop-YZG6qYVG.png?auto=compress%2Cformat" width="1504" height="943" loading="lazy"></picture></p><p>There is one new arrow in this diagram: <strong>disturbances</strong>. A controller has two jobs. The first is <a href="https://en.wikipedia.org/wiki/Setpoint_%28control_system%29">setpoint tracking</a>: someone edits the <code>.spec</code>, and the loop chases the new intent. The second is <a href="https://en.wikipedia.org/wiki/Control_theory">disturbance rejection</a>: the world changes on its own. A node dies, a customer starts a bulk import, someone deletes a Pod by hand. The level-triggered reconcile treats both the same way: it only sees the gap.</p><p>Our controller doesn&#x27;t always touch Postgres directly. Sometimes it writes a PVC and lets CSI do the storage work. Sometimes it creates a Pod and lets the scheduler and kubelet do their part. This is what a production operator looks like: one loop we write, surrounded by other loops we don&#x27;t write.</p><p>Notice that every decision in this loop has been binary: start the Pod or don&#x27;t, grow the disk or don&#x27;t, rewrite the config or don&#x27;t. That&#x27;s an <em>on/off controller</em>, and it covers most of what an operator does. But not every question is yes/no; once the answer becomes <em>how much</em> rather than <em>whether</em>, you need a controller with memory and a sense of trend: how long you&#x27;ve been off, and how fast it&#x27;s changing. That&#x27;s a separate post.</p><hr><h2 id="conclusion"><a href="https://planetscale.com/blog/the-feedback-loops-behind-kubernetes#conclusion">Conclusion</a></h2><p>All of this works, and most of the time it runs without anyone watching it. But the abstractions still leak, and they usually leak at a bad time.</p><p>Eventual consistency and the split between cache reads and API writes mean that a freshly-created object might not be visible to the thing that just created it. When something goes wrong, we&#x27;re debugging Kubernetes objects, database state, metrics, volume operations, and sometimes the cloud provider at the same time. The bug is usually not in one clean place.</p><p>The declarative model is wonderful until it meets an operation that&#x27;s inherently imperative and stateful, like a failover, a major-version upgrade, or a data migration. Then you have to turn a blocking, non-idempotent action into an idempotent one. That&#x27;s a whole other blog post.</p><p>That complexity is easy to underestimate. If you&#x27;re not dealing with sophisticated systems, if you can sacrifice availability, or if you don&#x27;t care about scalability, maybe all this machinery isn&#x27;t needed at all. Operators do not remove complexity. They move it into code someone has to understand.</p><p>I still think it&#x27;s worth it. For running thousands of databases that have to heal themselves without anyone watching, I don&#x27;t know a better alternative. The hard parts are hard because the problem is hard, not because Kubernetes made it hard.</p><p>Kubernetes is not only a container runtime. It&#x27;s not only a YAML processor, or an orchestrator, or whatever word we use that year. For me, the useful way to read Kubernetes is this: <strong>Kubernetes is a framework for feedback controllers</strong>, plus a consistent store to hold their setpoints and a shared event bus to wake them up.</p><p>Once you see that, the rest fits together. The kubelet, the scheduler, CSI, and your operator all read and write facts onto shared objects, and each one tries to move its own small part of the system toward the desired state. The core idea is still the same one we started with: write down what you want, look at what exists, make the next change, and repeat. Events wake the loop up, but the current state decides what happens.</p><p>Kubernetes didn&#x27;t invent these ideas; a thermostat had them long before us. The mapping to control theory is not perfect, and some boundaries are fuzzy. But the core idea holds. We are writing feedback loops in Go and applying them to databases. Mechanical and electrical engineers figured out how to build stable, long-running systems before us. Software engineering is still catching up, and Kubernetes gives us a practical way to use those ideas in production.</p>]]></content>
    <summary><![CDATA[Kubernetes is a framework for feedback controllers: write down what you want, observe what exists, make the next change, and repeat.]]></summary>
  </entry>
  <entry>
    <title>See what your database is doing right now with Connections</title>
    <link href="https://planetscale.com/blog/see-what-your-database-is-doing-right-now"/>
    <id>https://planetscale.com/blog/see-what-your-database-is-doing-right-now</id>
    <published>2026-06-15T00:00:00.000Z</published>
    <updated>2026-06-15T00:00:00.000Z</updated>
    <author>
      <name>Brett Warminski</name>
    </author>
    <category term="product"/>
    <content type="html"><![CDATA[<p>Much of database debugging eventually turns into carefully inspecting what each connection is doing. In Postgres, this means watching <code>pg_stat_activity</code> in a loop. In Vitess, it means watching <code>SHOW FULL PROCESSLIST</code> the same way.</p><p>Tools like <a href="https://planetscale.com/docs/postgres/monitoring/query-insights">Query Insights</a> are useful for exploring the recent history of queries. They can tell you what was slow, what&#x27;s consuming resources, and where to spend tuning effort.</p><p>But during an active incident, the questions are more immediate. What&#x27;s happening this second? Did the last thing I changed fix it?</p><h2 id="manual-monitoring"><a href="https://planetscale.com/blog/see-what-your-database-is-doing-right-now#manual-monitoring">Manual monitoring</a></h2><p>Here&#x27;s a manual version of this workflow in Postgres:</p><div class="code-block" data-language="sql"><div class="min-w-0 max-w-full"><pre class="shiki shiki-themes planetscale-light planetscale-dark" style="--shiki-light:#2b2b2b;--shiki-dark:#e1e1e1;--shiki-light-bg:#ebebeb;--shiki-dark-bg:#1a1a1a" tabindex="0"><code><span class="line"><span style="--shiki-light:#F35815;--shiki-dark:#F35815">SELECT</span><span style="--shiki-light:#2B2B2B;--shiki-dark:#E1E1E1"> pid, </span><span style="--shiki-light:#F35815;--shiki-dark:#F35815">state</span><span style="--shiki-light:#2B2B2B;--shiki-dark:#E1E1E1">, wait_event_type, wait_event,</span></span>
<span class="line"><span style="--shiki-light:#F35815;--shiki-dark:#F35815">       now</span><span style="--shiki-light:#616161;--shiki-dark:#C1C1C1">()</span><span style="--shiki-light:#F35815;--shiki-dark:#F35815"> -</span><span style="--shiki-light:#2B2B2B;--shiki-dark:#E1E1E1"> xact_start </span><span style="--shiki-light:#F35815;--shiki-dark:#F35815">AS</span><span style="--shiki-light:#2B2B2B;--shiki-dark:#E1E1E1"> tx_age,</span></span>
<span class="line"><span style="--shiki-light:#2B2B2B;--shiki-dark:#E1E1E1">       pg_blocking_pids(pid) </span><span style="--shiki-light:#F35815;--shiki-dark:#F35815">AS</span><span style="--shiki-light:#2B2B2B;--shiki-dark:#E1E1E1"> blocked_by,</span></span>
<span class="line"><span style="--shiki-light:#0B6EC5;--shiki-dark:#73C7F9">       left</span><span style="--shiki-light:#2B2B2B;--shiki-dark:#E1E1E1">(query, </span><span style="--shiki-light:#D92038;--shiki-dark:#FF7082">60</span><span style="--shiki-light:#2B2B2B;--shiki-dark:#E1E1E1">) </span><span style="--shiki-light:#F35815;--shiki-dark:#F35815">AS</span><span style="--shiki-light:#2B2B2B;--shiki-dark:#E1E1E1"> query</span></span>
<span class="line"><span style="--shiki-light:#F35815;--shiki-dark:#F35815">FROM</span><span style="--shiki-light:#2B2B2B;--shiki-dark:#E1E1E1"> pg_stat_activity</span></span>
<span class="line"><span style="--shiki-light:#F35815;--shiki-dark:#F35815">WHERE</span><span style="--shiki-light:#F35815;--shiki-dark:#F35815"> state</span><span style="--shiki-light:#F35815;--shiki-dark:#F35815"> &#x3C;></span><span style="--shiki-light:#13862E;--shiki-dark:#75DB8C"> 'idle'</span></span>
<span class="line"><span style="--shiki-light:#F35815;--shiki-dark:#F35815">ORDER BY</span><span style="--shiki-light:#2B2B2B;--shiki-dark:#E1E1E1"> tx_age </span><span style="--shiki-light:#F35815;--shiki-dark:#F35815">DESC</span><span style="--shiki-light:#2B2B2B;--shiki-dark:#E1E1E1">;</span></span>
<span class="line"></span></code></pre></div></div><p>Run it over and over again in a terminal and it&#x27;s a pretty effective view of the database.</p><p>It&#x27;s also a rough interface.</p><p>You&#x27;re scanning rows as they move around, trying to reconstruct what&#x27;s blocking progress, and hunting for the one detail that actually matters for the fix.</p><p>The worst version of this problem is when you can&#x27;t connect at all because the database has exhausted all of its connections. You can&#x27;t fix what you can&#x27;t connect to.</p><p>That workflow shaped the design of <strong>Connections</strong>, a new feature of the <code>pscale</code> CLI available today for PlanetScale Postgres and Vitess (MySQL) databases.</p><h2 id="simpler-debugging-with-connections"><a href="https://planetscale.com/blog/see-what-your-database-is-doing-right-now#simpler-debugging-with-connections">Simpler debugging with Connections</a></h2><p>Here&#x27;s that same debugging flow using the new <code>pscale branch connections top</code> functionality with a Postgres database, instead of pasting that <code>pg_stat_activity</code> query in a loop and comparing output:</p><div class="code-block" data-language="bash"><div class="min-w-0 max-w-full"><pre class="shiki shiki-themes planetscale-light planetscale-dark" style="--shiki-light:#2b2b2b;--shiki-dark:#e1e1e1;--shiki-light-bg:#ebebeb;--shiki-dark-bg:#1a1a1a" tabindex="0"><code><span class="line"><span style="--shiki-light:#F35815;--shiki-dark:#F35815">pscale</span><span style="--shiki-light:#414141;--shiki-dark:#C1C1C1"> branch</span><span style="--shiki-light:#414141;--shiki-dark:#C1C1C1"> connections</span><span style="--shiki-light:#414141;--shiki-dark:#C1C1C1"> top</span><span style="--shiki-light:#F35815;--shiki-dark:#F35815"> &#x3C;</span><span style="--shiki-light:#414141;--shiki-dark:#C1C1C1">databas</span><span style="--shiki-light:#2B2B2B;--shiki-dark:#E1E1E1">e</span><span style="--shiki-light:#F35815;--shiki-dark:#F35815">></span><span style="--shiki-light:#F35815;--shiki-dark:#F35815"> &#x3C;</span><span style="--shiki-light:#414141;--shiki-dark:#C1C1C1">branc</span><span style="--shiki-light:#2B2B2B;--shiki-dark:#E1E1E1">h</span><span style="--shiki-light:#F35815;--shiki-dark:#F35815">></span></span>
<span class="line"></span></code></pre></div></div><p>Connections opens an interactive live view that refreshes about once a second and sorts the sessions most likely to matter toward the top. There are keyboard shortcuts to navigate the list of connections and inspect each one in more detail.</p><p>Columns in the list include the Process ID (PID), status, number of blocked queries, why they&#x27;re waiting, and more.</p><p><picture class="block"><source media="(prefers-color-scheme: light), (prefers-color-scheme: no-preference)" srcSet="https://planetscale-images.imgix.net/assets/live-connections-top-DLKSy3CO.png?auto=compress%2Cformat"><img alt="The pscale branch connections top view, with a stuck checkout transaction at the top" src="https://planetscale-images.imgix.net/assets/live-connections-top-DLKSy3CO.png?auto=compress%2Cformat" width="2333" height="1409" loading="lazy"></picture></p><p>Say your writes are backing up and the app is timing out. In this example, an idle transaction from <code>checkout-api</code> is holding up three other writes. Open the row, and the blocker tree shows the queue behind it:</p><p><picture class="block"><source media="(prefers-color-scheme: light), (prefers-color-scheme: no-preference)" srcSet="https://planetscale-images.imgix.net/assets/live-connections-blockers-Dc1L2c1b.png?auto=compress%2Cformat"><img alt="The blocker tree: one idle checkout-api transaction holding up the refund, payment, and cancel updates queued behind it" src="https://planetscale-images.imgix.net/assets/live-connections-blockers-Dc1L2c1b.png?auto=compress%2Cformat" width="2355" height="1418" loading="lazy"></picture></p><p>From there you can decide whether the right fix is to cancel a query or terminate the connection. You no longer need to remember the syntax of <code>pg_stat_activity</code>, retrace the blocker chain by hand or copy and paste PIDs around.</p><h3 id="keep-enough-history-to-see-the-pattern"><a href="https://planetscale.com/blog/see-what-your-database-is-doing-right-now#keep-enough-history-to-see-the-pattern">Keep enough history to see the pattern</a></h3><p>Another problem with running that query in a loop is that the interesting moment flies by. Connections keeps a recent rolling history, so you can pause, step forward and backward with <code>[</code> and <code>]</code>, and see how the state has changed.</p><p>You can also capture a session to a file. You can record everything you see in Connections by pressing <code>C</code>. This includes the recent history already buffered in memory and keeps appending from there. Perfect for handing off logs to agents to assist with debugging.</p><p>That also makes it easier to write a postmortem, share what happened with a teammate, or replay the same view later instead of describing it from memory.</p><h2 id="available-even-when-connections-are-exhausted"><a href="https://planetscale.com/blog/see-what-your-database-is-doing-right-now#available-even-when-connections-are-exhausted">Available even when connections are exhausted</a></h2><p>The stress of debugging an active incident is worse when you can&#x27;t even connect to the database yourself.</p><p>Connections uses a reserved administrative connection, so the inspection path still works when regular application connections are exhausted.</p><p>Managed databases should remove the need to SSH into a box, not remove your ability to debug an incident.</p><p>You can still get in, see what is running, and act from there.</p><h2 id="for-postgres-and-vitess"><a href="https://planetscale.com/blog/see-what-your-database-is-doing-right-now#for-postgres-and-vitess">For Postgres and Vitess</a></h2><p>The PlanetScale CLI&#x27;s new Connections feature also works with Vitess databases (MySQL). In this case, the live view is the PlanetScale version of watching <code>SHOW FULL PROCESSLIST</code>, with the ability to cancel the current query or terminate the connection from this unified interface.</p><p>The main difference is scope. Vitess connections are shown for one keyspace (and one shard) at a time. If a branch has multiple keyspaces, or a sharded keyspace, pass <code>--keyspace</code> and <code>--shard</code> to choose the tablet:</p><div class="code-block" data-language="bash"><div class="min-w-0 max-w-full"><pre class="shiki shiki-themes planetscale-light planetscale-dark" style="--shiki-light:#2b2b2b;--shiki-dark:#e1e1e1;--shiki-light-bg:#ebebeb;--shiki-dark-bg:#1a1a1a" tabindex="0"><code><span class="line"><span style="--shiki-light:#F35815;--shiki-dark:#F35815">pscale</span><span style="--shiki-light:#414141;--shiki-dark:#C1C1C1"> branch</span><span style="--shiki-light:#414141;--shiki-dark:#C1C1C1"> connections</span><span style="--shiki-light:#414141;--shiki-dark:#C1C1C1"> top</span><span style="--shiki-light:#F35815;--shiki-dark:#F35815"> &#x3C;</span><span style="--shiki-light:#414141;--shiki-dark:#C1C1C1">databas</span><span style="--shiki-light:#2B2B2B;--shiki-dark:#E1E1E1">e</span><span style="--shiki-light:#F35815;--shiki-dark:#F35815">></span><span style="--shiki-light:#F35815;--shiki-dark:#F35815"> &#x3C;</span><span style="--shiki-light:#414141;--shiki-dark:#C1C1C1">branc</span><span style="--shiki-light:#2B2B2B;--shiki-dark:#E1E1E1">h</span><span style="--shiki-light:#F35815;--shiki-dark:#F35815">></span><span style="--shiki-light:#0B6EC5;--shiki-dark:#73C7F9"> -</span><span style="--shiki-light:#7D5903;--shiki-dark:#FED54A">-keyspace</span><span style="--shiki-light:#F35815;--shiki-dark:#F35815"> &#x3C;</span><span style="--shiki-light:#414141;--shiki-dark:#C1C1C1">keyspac</span><span style="--shiki-light:#2B2B2B;--shiki-dark:#E1E1E1">e</span><span style="--shiki-light:#F35815;--shiki-dark:#F35815">></span><span style="--shiki-light:#0B6EC5;--shiki-dark:#73C7F9"> -</span><span style="--shiki-light:#7D5903;--shiki-dark:#FED54A">-shard</span><span style="--shiki-light:#F35815;--shiki-dark:#F35815"> &#x3C;</span><span style="--shiki-light:#414141;--shiki-dark:#C1C1C1">shar</span><span style="--shiki-light:#2B2B2B;--shiki-dark:#E1E1E1">d</span><span style="--shiki-light:#F35815;--shiki-dark:#F35815">></span></span>
<span class="line"></span></code></pre></div></div><p>The same live monitoring, pause, history, capture, and replay workflow applies. The actions are MySQL-specific: canceling a query runs <code>KILL QUERY</code>, and terminating a connection runs <code>KILL</code>. See the <a href="https://planetscale.com/docs/vitess/monitoring/connections">Inspect live Vitess connections guide</a> for the full command behavior.</p><h2 id="try-it-today"><a href="https://planetscale.com/blog/see-what-your-database-is-doing-right-now#try-it-today">Try it today</a></h2><p>Connections is available for PlanetScale Postgres and Vitess. Update to the latest version of <a href="https://planetscale.com/docs/cli/planetscale-environment-setup"><code>pscale</code></a> and run:</p><div class="code-block" data-language="bash"><div class="min-w-0 max-w-full"><pre class="shiki shiki-themes planetscale-light planetscale-dark" style="--shiki-light:#2b2b2b;--shiki-dark:#e1e1e1;--shiki-light-bg:#ebebeb;--shiki-dark-bg:#1a1a1a" tabindex="0"><code><span class="line"><span style="--shiki-light:#F35815;--shiki-dark:#F35815">pscale</span><span style="--shiki-light:#414141;--shiki-dark:#C1C1C1"> branch</span><span style="--shiki-light:#414141;--shiki-dark:#C1C1C1"> connections</span><span style="--shiki-light:#414141;--shiki-dark:#C1C1C1"> top</span><span style="--shiki-light:#F35815;--shiki-dark:#F35815"> &#x3C;</span><span style="--shiki-light:#414141;--shiki-dark:#C1C1C1">databas</span><span style="--shiki-light:#2B2B2B;--shiki-dark:#E1E1E1">e</span><span style="--shiki-light:#F35815;--shiki-dark:#F35815">></span><span style="--shiki-light:#F35815;--shiki-dark:#F35815"> &#x3C;</span><span style="--shiki-light:#414141;--shiki-dark:#C1C1C1">branc</span><span style="--shiki-light:#2B2B2B;--shiki-dark:#E1E1E1">h</span><span style="--shiki-light:#F35815;--shiki-dark:#F35815">></span></span>
<span class="line"></span></code></pre></div></div><p>See the <a href="https://planetscale.com/docs/cli/connections">CLI reference</a>, the <a href="https://planetscale.com/docs/postgres/monitoring/connections">Inspect live Postgres connections guide</a>, and the <a href="https://planetscale.com/docs/vitess/monitoring/connections">Inspect live Vitess connections guide</a> for more details.</p><p>Try it next time you need to troubleshoot active database connections.</p>]]></content>
    <summary><![CDATA[Connections lets you monitor and manage all active connections to Postgres and Vitess databases. See active sessions, identify locking patterns, and keep debugging even when normal application connections are exhausted.]]></summary>
  </entry>
  <entry>
    <title>Egress problems and where to find them</title>
    <link href="https://planetscale.com/blog/database-egress"/>
    <id>https://planetscale.com/blog/database-egress</id>
    <published>2026-05-14T00:00:00.000Z</published>
    <updated>2026-05-14T00:00:00.000Z</updated>
    <author>
      <name>Simeon Griggs</name>
    </author>
    <category term="product"/>
    <content type="html"><![CDATA[<p>Name something in recent history that got better <em>and</em> cheaper (other than the TVs at the entrance of Costco). I&#x27;ll wait.</p><p>Better performance and lower costs rarely come together, but optimizing your queries to reduce egress gives you both.</p><p>So once you hit scale, or ideally before scale bites you, improving the efficiency of your queries by making the responses smaller and their frequency lower can pull off a rare double: make your application faster and cheaper.</p><iframe allow="autoplay; fullscreen; picture-in-picture" src="https://www.youtube-nocookie.com/embed/MXgCAI_il10?rel=0&color=white" title="Faster and cheaper database? Optimize your egress."></iframe><h2 id="definitions"><a href="https://planetscale.com/blog/database-egress#definitions">Definitions</a></h2><ul><li><strong>Egress:</strong> Data transferred out from your database over the public internet. Most cloud providers bill for this, so it&#x27;s something we want to minimize.</li><li><strong>Ingress:</strong> Data transferred into your database over the public internet. Most cloud providers either do <em>not</em> bill for this, or do so only in specific scenarios.</li></ul><p>PlanetScale includes 100GB of egress on High Availability (HA) plans. Non-HA $5/month Postgres includes 10GB of egress. Usage is <a href="https://planetscale.com/docs/postgres/pricing#public-traffic">metered</a> beyond those allowances, so it&#x27;s worth knowing about and minimizing where possible.</p><p>This post focuses largely on Postgres, but the general principles apply to all databases across all the major cloud providers.</p><h2 id="common-culprits"><a href="https://planetscale.com/blog/database-egress#common-culprits">Common culprits</a></h2><p>If your egress numbers are approaching the included quota, or exceeding it by more than you’d like, your problems likely stem from two things: you&#x27;re either fetching too much, too often, or both.</p><p>Consider the case of a content-heavy application. The database is full of documents made of rich text and block content. That content is stored in a JSONB column using the <a href="https://www.portabletext.org/">Portable Text</a> specification.</p><div class="code-block" data-language="sql"><div class="min-w-0 max-w-full"><pre class="shiki shiki-themes planetscale-light planetscale-dark" style="--shiki-light:#2b2b2b;--shiki-dark:#e1e1e1;--shiki-light-bg:#ebebeb;--shiki-dark-bg:#1a1a1a" tabindex="0"><code><span class="line"><span style="--shiki-light:#F35815;--shiki-dark:#F35815">CREATE</span><span style="--shiki-light:#F35815;--shiki-dark:#F35815"> TABLE</span><span style="--shiki-light:#5E49AF;--shiki-dark:#B7A5FB"> posts</span><span style="--shiki-light:#2B2B2B;--shiki-dark:#E1E1E1"> (</span></span>
<span class="line"><span style="--shiki-light:#2B2B2B;--shiki-dark:#E1E1E1">    id          </span><span style="--shiki-light:#F35815;--shiki-dark:#F35815">integer</span><span style="--shiki-light:#F35815;--shiki-dark:#F35815">                  NOT NULL</span><span style="--shiki-light:#F35815;--shiki-dark:#F35815"> DEFAULT</span><span style="--shiki-light:#2B2B2B;--shiki-dark:#E1E1E1"> nextval(</span><span style="--shiki-light:#13862E;--shiki-dark:#75DB8C">'posts_id_seq'</span><span style="--shiki-light:#2B2B2B;--shiki-dark:#E1E1E1">::regclass),</span></span>
<span class="line"><span style="--shiki-light:#2B2B2B;--shiki-dark:#E1E1E1">    title       </span><span style="--shiki-light:#F35815;--shiki-dark:#F35815">text</span><span style="--shiki-light:#F35815;--shiki-dark:#F35815">                     NOT NULL</span><span style="--shiki-light:#2B2B2B;--shiki-dark:#E1E1E1">,</span></span>
<span class="line"><span style="--shiki-light:#2B2B2B;--shiki-dark:#E1E1E1">    slug        </span><span style="--shiki-light:#F35815;--shiki-dark:#F35815">text</span><span style="--shiki-light:#F35815;--shiki-dark:#F35815">                     NOT NULL</span><span style="--shiki-light:#2B2B2B;--shiki-dark:#E1E1E1">,</span></span>
<span class="line"><span style="--shiki-light:#2B2B2B;--shiki-dark:#E1E1E1">    content     jsonb                    </span><span style="--shiki-light:#F35815;--shiki-dark:#F35815">NOT NULL</span><span style="--shiki-light:#F35815;--shiki-dark:#F35815"> DEFAULT</span><span style="--shiki-light:#13862E;--shiki-dark:#75DB8C"> '[]'</span><span style="--shiki-light:#2B2B2B;--shiki-dark:#E1E1E1">::jsonb,</span></span>
<span class="line"><span style="--shiki-light:#2B2B2B;--shiki-dark:#E1E1E1">    created_at  </span><span style="--shiki-light:#F35815;--shiki-dark:#F35815">timestamp with time zone</span><span style="--shiki-light:#F35815;--shiki-dark:#F35815"> NOT NULL</span><span style="--shiki-light:#F35815;--shiki-dark:#F35815"> DEFAULT</span><span style="--shiki-light:#F35815;--shiki-dark:#F35815"> now</span><span style="--shiki-light:#616161;--shiki-dark:#C1C1C1">()</span><span style="--shiki-light:#2B2B2B;--shiki-dark:#E1E1E1">,</span></span>
<span class="line"><span style="--shiki-light:#2B2B2B;--shiki-dark:#E1E1E1">    updated_at  </span><span style="--shiki-light:#F35815;--shiki-dark:#F35815">timestamp with time zone</span><span style="--shiki-light:#F35815;--shiki-dark:#F35815"> NOT NULL</span><span style="--shiki-light:#F35815;--shiki-dark:#F35815"> DEFAULT</span><span style="--shiki-light:#F35815;--shiki-dark:#F35815"> now</span><span style="--shiki-light:#616161;--shiki-dark:#C1C1C1">()</span><span style="--shiki-light:#2B2B2B;--shiki-dark:#E1E1E1">,</span></span>
<span class="line"><span style="--shiki-light:#F35815;--shiki-dark:#F35815">    CONSTRAINT</span><span style="--shiki-light:#2B2B2B;--shiki-dark:#E1E1E1">  posts_pkey </span><span style="--shiki-light:#F35815;--shiki-dark:#F35815">PRIMARY KEY</span><span style="--shiki-light:#2B2B2B;--shiki-dark:#E1E1E1"> (id),</span></span>
<span class="line"><span style="--shiki-light:#F35815;--shiki-dark:#F35815">    CONSTRAINT</span><span style="--shiki-light:#2B2B2B;--shiki-dark:#E1E1E1">  posts_slug_unique </span><span style="--shiki-light:#F35815;--shiki-dark:#F35815">UNIQUE</span><span style="--shiki-light:#2B2B2B;--shiki-dark:#E1E1E1"> (slug)</span></span>
<span class="line"><span style="--shiki-light:#2B2B2B;--shiki-dark:#E1E1E1">);</span></span>
<span class="line"></span></code></pre></div></div><h3 id="too-much-out"><a href="https://planetscale.com/blog/database-egress#too-much-out">Too much out</a></h3><p>Fetching too much is easily done. Performing a <code>SELECT *</code> query will return every value from every column in every matching result and will return more data as more columns are added. Likewise, &quot;unbounded queries,&quot; that is, a query without a limit, will linearly return more data as more matching data exists.</p><div class="code-block" data-language="sql"><div class="min-w-0 max-w-full"><pre class="shiki shiki-themes planetscale-light planetscale-dark" style="--shiki-light:#2b2b2b;--shiki-dark:#e1e1e1;--shiki-light-bg:#ebebeb;--shiki-dark-bg:#1a1a1a" tabindex="0"><code><span class="line"><span style="--shiki-light:#818181;--shiki-dark:#A1A1A1">-- ❌ returns unlimited columns and rows</span></span>
<span class="line"><span style="--shiki-light:#F35815;--shiki-dark:#F35815">SELECT</span><span style="--shiki-light:#F35815;--shiki-dark:#F35815"> *</span><span style="--shiki-light:#F35815;--shiki-dark:#F35815"> FROM</span><span style="--shiki-light:#2B2B2B;--shiki-dark:#E1E1E1"> posts;</span></span>
<span class="line"></span>
<span class="line"><span style="--shiki-light:#818181;--shiki-dark:#A1A1A1">-- ✅ returns limited columns and rows</span></span>
<span class="line"><span style="--shiki-light:#F35815;--shiki-dark:#F35815">SELECT</span><span style="--shiki-light:#2B2B2B;--shiki-dark:#E1E1E1"> id, title </span><span style="--shiki-light:#F35815;--shiki-dark:#F35815">FROM</span><span style="--shiki-light:#2B2B2B;--shiki-dark:#E1E1E1"> posts </span><span style="--shiki-light:#F35815;--shiki-dark:#F35815">LIMIT</span><span style="--shiki-light:#D92038;--shiki-dark:#FF7082"> 10</span><span style="--shiki-light:#2B2B2B;--shiki-dark:#E1E1E1">;</span></span>
<span class="line"></span></code></pre></div></div><p>Selecting specific columns has the added benefit of making your code more declarative about the data your application requires. While PlanetScale measures the data transfer size of your queries, it can&#x27;t make assumptions about how much of that query response was used. The more specific your queries are, the simpler the debugging process becomes.</p><p>For a JSONB column, you may also consider using Postgres&#x27; built-in syntax to extract specific values from the data if not all values are required.</p><p>For example, perhaps you want to build a table of contents from level 2 and 3 headings from our Portable Text column. An unspecific query would just return the entire content column.</p><div class="code-block" data-language="sql"><div class="min-w-0 max-w-full"><pre class="shiki shiki-themes planetscale-light planetscale-dark" style="--shiki-light:#2b2b2b;--shiki-dark:#e1e1e1;--shiki-light-bg:#ebebeb;--shiki-dark-bg:#1a1a1a" tabindex="0"><code><span class="line"><span style="--shiki-light:#F35815;--shiki-dark:#F35815">SELECT</span><span style="--shiki-light:#2B2B2B;--shiki-dark:#E1E1E1"> content </span><span style="--shiki-light:#F35815;--shiki-dark:#F35815">FROM</span><span style="--shiki-light:#2B2B2B;--shiki-dark:#E1E1E1"> posts </span><span style="--shiki-light:#F35815;--shiki-dark:#F35815">WHERE</span><span style="--shiki-light:#2B2B2B;--shiki-dark:#E1E1E1"> id </span><span style="--shiki-light:#F35815;--shiki-dark:#F35815">=</span><span style="--shiki-light:#D92038;--shiki-dark:#FF7082"> 1</span></span>
<span class="line"></span></code></pre></div></div><p>Instead, we can use the <code>jsonb_agg()</code> function in Postgres to filter the array of objects down to just the headings we&#x27;re looking for.</p><div class="code-block" data-language="sql"><div class="min-w-0 max-w-full"><pre class="shiki shiki-themes planetscale-light planetscale-dark" style="--shiki-light:#2b2b2b;--shiki-dark:#e1e1e1;--shiki-light-bg:#ebebeb;--shiki-dark-bg:#1a1a1a" tabindex="0"><code><span class="line"><span style="--shiki-light:#F35815;--shiki-dark:#F35815">SELECT</span><span style="--shiki-light:#2B2B2B;--shiki-dark:#E1E1E1"> jsonb_agg(</span><span style="--shiki-light:#F35815;--shiki-dark:#F35815">block</span><span style="--shiki-light:#2B2B2B;--shiki-dark:#E1E1E1">) </span><span style="--shiki-light:#F35815;--shiki-dark:#F35815">AS</span><span style="--shiki-light:#2B2B2B;--shiki-dark:#E1E1E1"> headings</span></span>
<span class="line"><span style="--shiki-light:#F35815;--shiki-dark:#F35815"> FROM</span></span>
<span class="line"><span style="--shiki-light:#2B2B2B;--shiki-dark:#E1E1E1">   posts,</span></span>
<span class="line"><span style="--shiki-light:#2B2B2B;--shiki-dark:#E1E1E1">   jsonb_array_elements(content) </span><span style="--shiki-light:#F35815;--shiki-dark:#F35815">AS</span><span style="--shiki-light:#F35815;--shiki-dark:#F35815"> block</span></span>
<span class="line"><span style="--shiki-light:#F35815;--shiki-dark:#F35815"> WHERE</span></span>
<span class="line"><span style="--shiki-light:#2B2B2B;--shiki-dark:#E1E1E1">   id </span><span style="--shiki-light:#F35815;--shiki-dark:#F35815">=</span><span style="--shiki-light:#D92038;--shiki-dark:#FF7082"> 1</span></span>
<span class="line"><span style="--shiki-light:#F35815;--shiki-dark:#F35815">   AND</span><span style="--shiki-light:#F35815;--shiki-dark:#F35815"> block->></span><span style="--shiki-light:#13862E;--shiki-dark:#75DB8C">'_type'</span><span style="--shiki-light:#F35815;--shiki-dark:#F35815"> =</span><span style="--shiki-light:#13862E;--shiki-dark:#75DB8C"> 'block'</span></span>
<span class="line"><span style="--shiki-light:#F35815;--shiki-dark:#F35815">   AND</span><span style="--shiki-light:#F35815;--shiki-dark:#F35815"> block->></span><span style="--shiki-light:#13862E;--shiki-dark:#75DB8C">'style'</span><span style="--shiki-light:#F35815;--shiki-dark:#F35815"> IN</span><span style="--shiki-light:#2B2B2B;--shiki-dark:#E1E1E1"> (</span><span style="--shiki-light:#13862E;--shiki-dark:#75DB8C">'h2'</span><span style="--shiki-light:#2B2B2B;--shiki-dark:#E1E1E1">, </span><span style="--shiki-light:#13862E;--shiki-dark:#75DB8C">'h3'</span><span style="--shiki-light:#2B2B2B;--shiki-dark:#E1E1E1">);</span></span>
<span class="line"></span></code></pre></div></div><p>Including JSON filtering will introduce some CPU overhead, so it&#x27;s a tradeoff. Monitor resource usage and see if the reduced egress is worth it.</p><p>Fetch only the rows, columns, and data from those columns that your application requires.</p><p>Pagination also bounds how much data leaves your database per request. Without it, a growing dataset means ever-larger responses. Two common approaches:</p><p><strong>Offset/limit</strong> skips a number of rows and returns a fixed page size. Simple to implement, but the database still scans all skipped rows, so deeper pages cost more.</p><div class="code-block" data-language="sql"><div class="min-w-0 max-w-full"><pre class="shiki shiki-themes planetscale-light planetscale-dark" style="--shiki-light:#2b2b2b;--shiki-dark:#e1e1e1;--shiki-light-bg:#ebebeb;--shiki-dark-bg:#1a1a1a" tabindex="0"><code><span class="line"><span style="--shiki-light:#F35815;--shiki-dark:#F35815">SELECT</span><span style="--shiki-light:#2B2B2B;--shiki-dark:#E1E1E1"> id, title </span><span style="--shiki-light:#F35815;--shiki-dark:#F35815">FROM</span><span style="--shiki-light:#2B2B2B;--shiki-dark:#E1E1E1"> posts </span><span style="--shiki-light:#F35815;--shiki-dark:#F35815">ORDER BY</span><span style="--shiki-light:#2B2B2B;--shiki-dark:#E1E1E1"> id </span><span style="--shiki-light:#F35815;--shiki-dark:#F35815">LIMIT</span><span style="--shiki-light:#D92038;--shiki-dark:#FF7082"> 10</span><span style="--shiki-light:#2B2B2B;--shiki-dark:#E1E1E1"> OFFSET </span><span style="--shiki-light:#D92038;--shiki-dark:#FF7082">0</span><span style="--shiki-light:#2B2B2B;--shiki-dark:#E1E1E1">;  </span><span style="--shiki-light:#818181;--shiki-dark:#A1A1A1">-- page 1</span></span>
<span class="line"><span style="--shiki-light:#F35815;--shiki-dark:#F35815">SELECT</span><span style="--shiki-light:#2B2B2B;--shiki-dark:#E1E1E1"> id, title </span><span style="--shiki-light:#F35815;--shiki-dark:#F35815">FROM</span><span style="--shiki-light:#2B2B2B;--shiki-dark:#E1E1E1"> posts </span><span style="--shiki-light:#F35815;--shiki-dark:#F35815">ORDER BY</span><span style="--shiki-light:#2B2B2B;--shiki-dark:#E1E1E1"> id </span><span style="--shiki-light:#F35815;--shiki-dark:#F35815">LIMIT</span><span style="--shiki-light:#D92038;--shiki-dark:#FF7082"> 10</span><span style="--shiki-light:#2B2B2B;--shiki-dark:#E1E1E1"> OFFSET </span><span style="--shiki-light:#D92038;--shiki-dark:#FF7082">10</span><span style="--shiki-light:#2B2B2B;--shiki-dark:#E1E1E1">; </span><span style="--shiki-light:#818181;--shiki-dark:#A1A1A1">-- page 2</span></span>
<span class="line"></span></code></pre></div></div><p><strong>Cursor pagination</strong> uses the last value from the previous page as the starting point. It performs consistently regardless of depth.</p><div class="code-block" data-language="sql"><div class="min-w-0 max-w-full"><pre class="shiki shiki-themes planetscale-light planetscale-dark" style="--shiki-light:#2b2b2b;--shiki-dark:#e1e1e1;--shiki-light-bg:#ebebeb;--shiki-dark-bg:#1a1a1a" tabindex="0"><code><span class="line"><span style="--shiki-light:#F35815;--shiki-dark:#F35815">SELECT</span><span style="--shiki-light:#2B2B2B;--shiki-dark:#E1E1E1"> id, title </span><span style="--shiki-light:#F35815;--shiki-dark:#F35815">FROM</span><span style="--shiki-light:#2B2B2B;--shiki-dark:#E1E1E1"> posts </span><span style="--shiki-light:#F35815;--shiki-dark:#F35815">ORDER BY</span><span style="--shiki-light:#2B2B2B;--shiki-dark:#E1E1E1"> id </span><span style="--shiki-light:#F35815;--shiki-dark:#F35815">LIMIT</span><span style="--shiki-light:#D92038;--shiki-dark:#FF7082"> 10</span><span style="--shiki-light:#2B2B2B;--shiki-dark:#E1E1E1">;                </span><span style="--shiki-light:#818181;--shiki-dark:#A1A1A1">-- page 1</span></span>
<span class="line"><span style="--shiki-light:#F35815;--shiki-dark:#F35815">SELECT</span><span style="--shiki-light:#2B2B2B;--shiki-dark:#E1E1E1"> id, title </span><span style="--shiki-light:#F35815;--shiki-dark:#F35815">FROM</span><span style="--shiki-light:#2B2B2B;--shiki-dark:#E1E1E1"> posts </span><span style="--shiki-light:#F35815;--shiki-dark:#F35815">WHERE</span><span style="--shiki-light:#2B2B2B;--shiki-dark:#E1E1E1"> id </span><span style="--shiki-light:#F35815;--shiki-dark:#F35815">></span><span style="--shiki-light:#D92038;--shiki-dark:#FF7082"> 10</span><span style="--shiki-light:#F35815;--shiki-dark:#F35815"> ORDER BY</span><span style="--shiki-light:#2B2B2B;--shiki-dark:#E1E1E1"> id </span><span style="--shiki-light:#F35815;--shiki-dark:#F35815">LIMIT</span><span style="--shiki-light:#D92038;--shiki-dark:#FF7082"> 10</span><span style="--shiki-light:#2B2B2B;--shiki-dark:#E1E1E1">; </span><span style="--shiki-light:#818181;--shiki-dark:#A1A1A1">-- page 2</span></span>
<span class="line"></span></code></pre></div></div><p>For more detail on each approach to pagination, see <a href="https://planetscale.com/learn/courses/mysql-for-developers/examples/offset-limit-pagination">Offset limit pagination</a> and <a href="https://planetscale.com/learn/courses/mysql-for-developers/examples/cursor-pagination">Cursor pagination</a> in the MySQL for Developers course.</p><h3 id="too-much-in"><a href="https://planetscale.com/blog/database-egress#too-much-in">Too much in</a></h3><p>While most cloud providers do not typically charge for ingress, there are instances where your ingress operations quietly result in egress.</p><p>ORMs can have this happen by default when returning data from an insert operation. Here is an example insertion operation using Drizzle.</p><div class="code-block" data-language="javascript"><div class="min-w-0 max-w-full"><pre class="shiki shiki-themes planetscale-light planetscale-dark" style="--shiki-light:#2b2b2b;--shiki-dark:#e1e1e1;--shiki-light-bg:#ebebeb;--shiki-dark-bg:#1a1a1a" tabindex="0"><code><span class="line"><span style="--shiki-light:#F35815;--shiki-dark:#F35815">const</span><span style="--shiki-light:#A78103;--shiki-dark:#F2B600"> post</span><span style="--shiki-light:#F35815;--shiki-dark:#F35815"> =</span><span style="--shiki-light:#F35815;--shiki-dark:#F35815"> await</span><span style="--shiki-light:#A78103;--shiki-dark:#F2B600"> db</span></span>
<span class="line"><span style="--shiki-light:#616161;--shiki-dark:#C1C1C1">  .</span><span style="--shiki-light:#5E49AF;--shiki-dark:#B7A5FB">insert</span><span style="--shiki-light:#616161;--shiki-dark:#C1C1C1">(</span><span style="--shiki-light:#A78103;--shiki-dark:#F2B600">posts</span><span style="--shiki-light:#616161;--shiki-dark:#C1C1C1">)</span></span>
<span class="line"><span style="--shiki-light:#616161;--shiki-dark:#C1C1C1">  .</span><span style="--shiki-light:#5E49AF;--shiki-dark:#B7A5FB">values</span><span style="--shiki-light:#616161;--shiki-dark:#C1C1C1">({</span><span style="--shiki-light:#2B2B2B;--shiki-dark:#E1E1E1"> title</span><span style="--shiki-light:#616161;--shiki-dark:#C1C1C1">:</span><span style="--shiki-light:#13862E;--shiki-dark:#75DB8C"> 'Hello world'</span><span style="--shiki-light:#616161;--shiki-dark:#C1C1C1">,</span><span style="--shiki-light:#2B2B2B;--shiki-dark:#E1E1E1"> slug</span><span style="--shiki-light:#616161;--shiki-dark:#C1C1C1">:</span><span style="--shiki-light:#13862E;--shiki-dark:#75DB8C"> 'hello-world'</span><span style="--shiki-light:#616161;--shiki-dark:#C1C1C1"> })</span></span>
<span class="line"><span style="--shiki-light:#818181;--shiki-dark:#A1A1A1">  // ❌ returns everything with no parameters</span></span>
<span class="line"><span style="--shiki-light:#616161;--shiki-dark:#C1C1C1">  .</span><span style="--shiki-light:#5E49AF;--shiki-dark:#B7A5FB">returning</span><span style="--shiki-light:#616161;--shiki-dark:#C1C1C1">()</span></span>
<span class="line"></span></code></pre></div></div><p>The function call above would result in an SQL query like this.</p><div class="code-block" data-language="sql"><div class="min-w-0 max-w-full"><pre class="shiki shiki-themes planetscale-light planetscale-dark" style="--shiki-light:#2b2b2b;--shiki-dark:#e1e1e1;--shiki-light-bg:#ebebeb;--shiki-dark-bg:#1a1a1a" tabindex="0"><code><span class="line"><span style="--shiki-light:#F35815;--shiki-dark:#F35815">INSERT INTO</span></span>
<span class="line"><span style="--shiki-light:#2B2B2B;--shiki-dark:#E1E1E1">	posts (title, slug)</span></span>
<span class="line"><span style="--shiki-light:#F35815;--shiki-dark:#F35815">VALUES</span></span>
<span class="line"><span style="--shiki-light:#2B2B2B;--shiki-dark:#E1E1E1">	(</span><span style="--shiki-light:#13862E;--shiki-dark:#75DB8C">'Hello world'</span><span style="--shiki-light:#2B2B2B;--shiki-dark:#E1E1E1">, </span><span style="--shiki-light:#13862E;--shiki-dark:#75DB8C">'hello-world'</span><span style="--shiki-light:#2B2B2B;--shiki-dark:#E1E1E1">)</span></span>
<span class="line"><span style="--shiki-light:#2B2B2B;--shiki-dark:#E1E1E1">RETURNING</span></span>
<span class="line"><span style="--shiki-light:#F35815;--shiki-dark:#F35815">    *</span><span style="--shiki-light:#2B2B2B;--shiki-dark:#E1E1E1">;</span></span>
<span class="line"></span></code></pre></div></div><p>In this particular instance, we&#x27;re only writing the <code>title</code> and <code>slug</code>, so the response is relatively small in terms of bytes transferred. It&#x27;s worth noting, however, that more columns were returned than were written.</p><div class="code-block" data-language="sql"><div class="min-w-0 max-w-full"><pre class="shiki shiki-themes planetscale-light planetscale-dark" style="--shiki-light:#2b2b2b;--shiki-dark:#e1e1e1;--shiki-light-bg:#ebebeb;--shiki-dark-bg:#1a1a1a" tabindex="0"><code><span class="line"><span style="--shiki-light:#F35815;--shiki-dark:#F35815">+</span><span style="--shiki-light:#818181;--shiki-dark:#A1A1A1">----+-------------+-------------+---------+-------------------------------+-------------------------------+</span></span>
<span class="line"><span style="--shiki-light:#2B2B2B;--shiki-dark:#E1E1E1">| id | title       | slug        | content | created_at                    | updated_at                    |</span></span>
<span class="line"><span style="--shiki-light:#2B2B2B;--shiki-dark:#E1E1E1">|</span><span style="--shiki-light:#818181;--shiki-dark:#A1A1A1">----+-------------+-------------+---------+-------------------------------+-------------------------------|</span></span>
<span class="line"><span style="--shiki-light:#2B2B2B;--shiki-dark:#E1E1E1">| </span><span style="--shiki-light:#D92038;--shiki-dark:#FF7082">5</span><span style="--shiki-light:#2B2B2B;--shiki-dark:#E1E1E1">  | Hello world | hello</span><span style="--shiki-light:#F35815;--shiki-dark:#F35815">-</span><span style="--shiki-light:#2B2B2B;--shiki-dark:#E1E1E1">world | []      | </span><span style="--shiki-light:#D92038;--shiki-dark:#FF7082">2026</span><span style="--shiki-light:#F35815;--shiki-dark:#F35815">-</span><span style="--shiki-light:#D92038;--shiki-dark:#FF7082">05</span><span style="--shiki-light:#F35815;--shiki-dark:#F35815">-</span><span style="--shiki-light:#D92038;--shiki-dark:#FF7082">11</span><span style="--shiki-light:#D92038;--shiki-dark:#FF7082"> 16</span><span style="--shiki-light:#2B2B2B;--shiki-dark:#E1E1E1">:</span><span style="--shiki-light:#D92038;--shiki-dark:#FF7082">04</span><span style="--shiki-light:#2B2B2B;--shiki-dark:#E1E1E1">:</span><span style="--shiki-light:#D92038;--shiki-dark:#FF7082">03</span><span style="--shiki-light:#2B2B2B;--shiki-dark:#E1E1E1">.</span><span style="--shiki-light:#D92038;--shiki-dark:#FF7082">049885</span><span style="--shiki-light:#F35815;--shiki-dark:#F35815">+</span><span style="--shiki-light:#D92038;--shiki-dark:#FF7082">01</span><span style="--shiki-light:#2B2B2B;--shiki-dark:#E1E1E1"> | </span><span style="--shiki-light:#D92038;--shiki-dark:#FF7082">2026</span><span style="--shiki-light:#F35815;--shiki-dark:#F35815">-</span><span style="--shiki-light:#D92038;--shiki-dark:#FF7082">05</span><span style="--shiki-light:#F35815;--shiki-dark:#F35815">-</span><span style="--shiki-light:#D92038;--shiki-dark:#FF7082">11</span><span style="--shiki-light:#D92038;--shiki-dark:#FF7082"> 16</span><span style="--shiki-light:#2B2B2B;--shiki-dark:#E1E1E1">:</span><span style="--shiki-light:#D92038;--shiki-dark:#FF7082">04</span><span style="--shiki-light:#2B2B2B;--shiki-dark:#E1E1E1">:</span><span style="--shiki-light:#D92038;--shiki-dark:#FF7082">03</span><span style="--shiki-light:#2B2B2B;--shiki-dark:#E1E1E1">.</span><span style="--shiki-light:#D92038;--shiki-dark:#FF7082">049885</span><span style="--shiki-light:#F35815;--shiki-dark:#F35815">+</span><span style="--shiki-light:#D92038;--shiki-dark:#FF7082">01</span><span style="--shiki-light:#2B2B2B;--shiki-dark:#E1E1E1"> |</span></span>
<span class="line"><span style="--shiki-light:#F35815;--shiki-dark:#F35815">+</span><span style="--shiki-light:#818181;--shiki-dark:#A1A1A1">----+-------------+-------------+---------+-------------------------------+-------------------------------+</span></span>
<span class="line"></span></code></pre></div></div><p>The <code>content</code> column is small for now, but if we were writing an <code>UPDATE</code> to an existing and very large document, it would be returned with every operation.</p><p>Now imagine our content editor upserts changes to an edited document <strong>every second</strong>. This could be a massive payload of our Portable Text JSON, with every insert operation returning the full body of the inserted item, essentially doubling the operation&#x27;s egress.</p><div class="code-block" data-language="javascript"><div class="min-w-0 max-w-full"><pre class="shiki shiki-themes planetscale-light planetscale-dark" style="--shiki-light:#2b2b2b;--shiki-dark:#e1e1e1;--shiki-light-bg:#ebebeb;--shiki-dark-bg:#1a1a1a" tabindex="0"><code><span class="line"><span style="--shiki-light:#F35815;--shiki-dark:#F35815">const</span><span style="--shiki-light:#A78103;--shiki-dark:#F2B600"> post</span><span style="--shiki-light:#F35815;--shiki-dark:#F35815"> =</span><span style="--shiki-light:#F35815;--shiki-dark:#F35815"> await</span><span style="--shiki-light:#A78103;--shiki-dark:#F2B600"> db</span></span>
<span class="line"><span style="--shiki-light:#616161;--shiki-dark:#C1C1C1">  .</span><span style="--shiki-light:#5E49AF;--shiki-dark:#B7A5FB">insert</span><span style="--shiki-light:#616161;--shiki-dark:#C1C1C1">(</span><span style="--shiki-light:#A78103;--shiki-dark:#F2B600">posts</span><span style="--shiki-light:#616161;--shiki-dark:#C1C1C1">)</span></span>
<span class="line"><span style="--shiki-light:#616161;--shiki-dark:#C1C1C1">  .</span><span style="--shiki-light:#5E49AF;--shiki-dark:#B7A5FB">values</span><span style="--shiki-light:#616161;--shiki-dark:#C1C1C1">({</span><span style="--shiki-light:#2B2B2B;--shiki-dark:#E1E1E1"> title</span><span style="--shiki-light:#616161;--shiki-dark:#C1C1C1">:</span><span style="--shiki-light:#13862E;--shiki-dark:#75DB8C"> 'Hello world'</span><span style="--shiki-light:#616161;--shiki-dark:#C1C1C1">,</span><span style="--shiki-light:#2B2B2B;--shiki-dark:#E1E1E1"> slug</span><span style="--shiki-light:#616161;--shiki-dark:#C1C1C1">:</span><span style="--shiki-light:#13862E;--shiki-dark:#75DB8C"> 'hello-world'</span><span style="--shiki-light:#616161;--shiki-dark:#C1C1C1"> })</span></span>
<span class="line"><span style="--shiki-light:#818181;--shiki-dark:#A1A1A1">  // ✅ returns only the id column</span></span>
<span class="line"><span style="--shiki-light:#616161;--shiki-dark:#C1C1C1">  .</span><span style="--shiki-light:#5E49AF;--shiki-dark:#B7A5FB">returning</span><span style="--shiki-light:#616161;--shiki-dark:#C1C1C1">({</span><span style="--shiki-light:#2B2B2B;--shiki-dark:#E1E1E1"> id</span><span style="--shiki-light:#616161;--shiki-dark:#C1C1C1">:</span><span style="--shiki-light:#A78103;--shiki-dark:#F2B600"> posts</span><span style="--shiki-light:#616161;--shiki-dark:#C1C1C1">.</span><span style="--shiki-light:#A78103;--shiki-dark:#F2B600">id</span><span style="--shiki-light:#616161;--shiki-dark:#C1C1C1"> })</span></span>
<span class="line"></span></code></pre></div></div><p>Return only what you need, if anything.</p><h3 id="too-often"><a href="https://planetscale.com/blog/database-egress#too-often">Too often</a></h3><p>If every user of your application requesting the same data results in a fresh request to your database, you&#x27;re wasting your egress quota.</p><p>In the simplified diagram below, that means trying to avoid every <strong>user request</strong> from triggering fresh <strong>egress</strong> to generate a <strong>response</strong>.</p><p><picture class="block"><source media="(prefers-color-scheme: light), (prefers-color-scheme: no-preference)" srcSet="https://planetscale-images.imgix.net/assets/egress-diagram-DjldZPAs.png?auto=compress%2Cformat"><source media="(prefers-color-scheme: dark)" srcSet="https://planetscale-images.imgix.net/assets/egress-diagram-darkmode-DalhYnZi.png?auto=compress%2Cformat"><img alt="Egress diagram" src="https://planetscale-images.imgix.net/assets/egress-diagram-DjldZPAs.png?auto=compress%2Cformat" width="1630" height="738" loading="lazy"></picture></p><p>Caching and Content Delivery Networks (CDNs) exist largely to improve performance. One way they achieve this is by reducing data transfer. By loading a local copy of the data your application needs instead of fetching it fresh from the database.</p><p>An application-level cache (like Redis) between your database and application, or a network-level cache (like a CDN) between your application and a user, can help reduce the frequency of requests to your database.</p><p>Preventing unnecessary work in your database is increasingly important as your dataset grows and the frequency of requests increases. A single JSONB column of Portable Text, for example, could get into megabytes in size, and you won&#x27;t want it requested from the database with each page load, should your article hit the front page of Hacker News.</p><h3 id="too-internet"><a href="https://planetscale.com/blog/database-egress#too-internet">Too internet</a></h3><p>Egress is typically charged when data travels over the public Internet. PlanetScale supports AWS PrivateLink and GCP Private Service Connect to improve security and reduce egress costs (another win-win combo).</p><p>If your application is hosted within the same infrastructure as your database (and it should be), you may be able to use either of these private connections to skip this public internet hop.</p><p>PlanetScale charges much lower rates for data transferred over these private connections, however, both ingress and egress are billed. See the documentation for more pricing details and to see if this is an option for you.</p><p>Read more: <a href="https://planetscale.com/docs/postgres/connecting/private-connections">Private connections in the PlanetScale docs</a></p><h2 id="identifying-egress-usage"><a href="https://planetscale.com/blog/database-egress#identifying-egress-usage">Identifying egress usage</a></h2><p>PlanetScale Postgres offers us ways to measure the bytes returned by individual queries, but not to observe egress bytes usage patterns over time. Let&#x27;s look first at what it takes to measure a query.</p><h3 id="with-explain"><a href="https://planetscale.com/blog/database-egress#with-explain">With EXPLAIN</a></h3><p>If we prepend <code>EXPLAIN</code> to the same unbounded, unspecific query as before, we&#x27;re shown the query plan for the response.</p><div class="code-block" data-language="sql"><div class="min-w-0 max-w-full"><pre class="shiki shiki-themes planetscale-light planetscale-dark" style="--shiki-light:#2b2b2b;--shiki-dark:#e1e1e1;--shiki-light-bg:#ebebeb;--shiki-dark-bg:#1a1a1a" tabindex="0"><code><span class="line"><span style="--shiki-light:#F35815;--shiki-dark:#F35815">></span><span style="--shiki-light:#2B2B2B;--shiki-dark:#E1E1E1"> EXPLAIN </span><span style="--shiki-light:#F35815;--shiki-dark:#F35815">SELECT</span><span style="--shiki-light:#F35815;--shiki-dark:#F35815"> *</span><span style="--shiki-light:#F35815;--shiki-dark:#F35815"> FROM</span><span style="--shiki-light:#2B2B2B;--shiki-dark:#E1E1E1"> posts;</span></span>
<span class="line"></span>
<span class="line"><span style="--shiki-light:#F35815;--shiki-dark:#F35815">+</span><span style="--shiki-light:#818181;--shiki-dark:#A1A1A1">----------------------------------------------------------+</span></span>
<span class="line"><span style="--shiki-light:#2B2B2B;--shiki-dark:#E1E1E1">| QUERY PLAN                                               |</span></span>
<span class="line"><span style="--shiki-light:#2B2B2B;--shiki-dark:#E1E1E1">|</span><span style="--shiki-light:#818181;--shiki-dark:#A1A1A1">----------------------------------------------------------|</span></span>
<span class="line"><span style="--shiki-light:#2B2B2B;--shiki-dark:#E1E1E1">| Seq Scan </span><span style="--shiki-light:#F35815;--shiki-dark:#F35815">on</span><span style="--shiki-light:#2B2B2B;--shiki-dark:#E1E1E1"> posts  (cost</span><span style="--shiki-light:#F35815;--shiki-dark:#F35815">=</span><span style="--shiki-light:#D92038;--shiki-dark:#FF7082">0</span><span style="--shiki-light:#2B2B2B;--shiki-dark:#E1E1E1">.</span><span style="--shiki-light:#D92038;--shiki-dark:#FF7082">00</span><span style="--shiki-light:#2B2B2B;--shiki-dark:#E1E1E1">..</span><span style="--shiki-light:#D92038;--shiki-dark:#FF7082">15</span><span style="--shiki-light:#2B2B2B;--shiki-dark:#E1E1E1">.</span><span style="--shiki-light:#D92038;--shiki-dark:#FF7082">60</span><span style="--shiki-light:#F35815;--shiki-dark:#F35815"> rows=</span><span style="--shiki-light:#D92038;--shiki-dark:#FF7082">560</span><span style="--shiki-light:#2B2B2B;--shiki-dark:#E1E1E1"> width</span><span style="--shiki-light:#F35815;--shiki-dark:#F35815">=</span><span style="--shiki-light:#D92038;--shiki-dark:#FF7082">116</span><span style="--shiki-light:#2B2B2B;--shiki-dark:#E1E1E1">) |</span></span>
<span class="line"><span style="--shiki-light:#F35815;--shiki-dark:#F35815">+</span><span style="--shiki-light:#818181;--shiki-dark:#A1A1A1">----------------------------------------------------------+</span></span>
<span class="line"></span></code></pre></div></div><p>The query plan shows us <code>rows=560</code>, an estimate of the number of rows returned, and <code>width=116</code>, an estimate of the size of each row. These estimates are based on averages and won&#x27;t reflect the size of any particular row, especially for variable-length columns like JSONB.</p><p>The only way to accurately measure the transfer size of a query is to run it. Let&#x27;s measure the difference between querying the full content column of a post compared to just extracting the headings.</p><p>We could use <code>pg_column_size()</code> to measure the size of the content column, but it would return the TOAST-compressed size, not the size of the data being sent over the wire. <code>octet_length()</code> will return a closer approximation of the relative size.</p><div class="mb-3 border p-3 border-blue-600 dark:border-blue-500"><p><span class="bg-blue-600 px-sm text-white dark:bg-blue-500 dark:text-black">Note</span></p><p>Postgres uses <a href="https://www.postgresql.org/docs/current/storage-toast.html">TOAST</a> (The Oversized-Attribute Storage Technique) to compress and store large values, such as our JSONB column, so its on-disk size is dramatically smaller than its measured egress size. TOAST-compressed data is decompressed and serialized before being sent over the wire.</p></div><div class="code-block" data-language="sql"><div class="min-w-0 max-w-full"><pre class="shiki shiki-themes planetscale-light planetscale-dark" style="--shiki-light:#2b2b2b;--shiki-dark:#e1e1e1;--shiki-light-bg:#ebebeb;--shiki-dark-bg:#1a1a1a" tabindex="0"><code><span class="line"><span style="--shiki-light:#818181;--shiki-dark:#A1A1A1">-- Full content column</span></span>
<span class="line"><span style="--shiki-light:#F35815;--shiki-dark:#F35815">SELECT</span><span style="--shiki-light:#2B2B2B;--shiki-dark:#E1E1E1"> pg_size_pretty(octet_length(content::</span><span style="--shiki-light:#F35815;--shiki-dark:#F35815">text</span><span style="--shiki-light:#2B2B2B;--shiki-dark:#E1E1E1">)::</span><span style="--shiki-light:#F35815;--shiki-dark:#F35815">bigint</span><span style="--shiki-light:#2B2B2B;--shiki-dark:#E1E1E1">)</span></span>
<span class="line"><span style="--shiki-light:#F35815;--shiki-dark:#F35815">FROM</span><span style="--shiki-light:#2B2B2B;--shiki-dark:#E1E1E1"> posts </span><span style="--shiki-light:#F35815;--shiki-dark:#F35815">WHERE</span><span style="--shiki-light:#2B2B2B;--shiki-dark:#E1E1E1"> id </span><span style="--shiki-light:#F35815;--shiki-dark:#F35815">=</span><span style="--shiki-light:#D92038;--shiki-dark:#FF7082"> 1</span><span style="--shiki-light:#2B2B2B;--shiki-dark:#E1E1E1">;</span></span>
<span class="line"></span>
<span class="line"><span style="--shiki-light:#F35815;--shiki-dark:#F35815">+</span><span style="--shiki-light:#818181;--shiki-dark:#A1A1A1">----------------+</span></span>
<span class="line"><span style="--shiki-light:#2B2B2B;--shiki-dark:#E1E1E1">| pg_size_pretty |</span></span>
<span class="line"><span style="--shiki-light:#2B2B2B;--shiki-dark:#E1E1E1">|</span><span style="--shiki-light:#818181;--shiki-dark:#A1A1A1">----------------|</span></span>
<span class="line"><span style="--shiki-light:#2B2B2B;--shiki-dark:#E1E1E1">| </span><span style="--shiki-light:#D92038;--shiki-dark:#FF7082">37</span><span style="--shiki-light:#2B2B2B;--shiki-dark:#E1E1E1"> kB          |</span></span>
<span class="line"><span style="--shiki-light:#F35815;--shiki-dark:#F35815">+</span><span style="--shiki-light:#818181;--shiki-dark:#A1A1A1">----------------+</span></span>
<span class="line"></span>
<span class="line"><span style="--shiki-light:#818181;--shiki-dark:#A1A1A1">-- Just the headings</span></span>
<span class="line"><span style="--shiki-light:#F35815;--shiki-dark:#F35815">SELECT</span><span style="--shiki-light:#2B2B2B;--shiki-dark:#E1E1E1"> pg_size_pretty(octet_length(jsonb_agg(</span><span style="--shiki-light:#F35815;--shiki-dark:#F35815">block</span><span style="--shiki-light:#2B2B2B;--shiki-dark:#E1E1E1">)::</span><span style="--shiki-light:#F35815;--shiki-dark:#F35815">text</span><span style="--shiki-light:#2B2B2B;--shiki-dark:#E1E1E1">)::</span><span style="--shiki-light:#F35815;--shiki-dark:#F35815">bigint</span><span style="--shiki-light:#2B2B2B;--shiki-dark:#E1E1E1">)</span></span>
<span class="line"><span style="--shiki-light:#F35815;--shiki-dark:#F35815">FROM</span><span style="--shiki-light:#2B2B2B;--shiki-dark:#E1E1E1"> posts,</span></span>
<span class="line"><span style="--shiki-light:#2B2B2B;--shiki-dark:#E1E1E1">  jsonb_array_elements(content) </span><span style="--shiki-light:#F35815;--shiki-dark:#F35815">AS</span><span style="--shiki-light:#F35815;--shiki-dark:#F35815"> block</span></span>
<span class="line"><span style="--shiki-light:#F35815;--shiki-dark:#F35815">WHERE</span><span style="--shiki-light:#2B2B2B;--shiki-dark:#E1E1E1"> id </span><span style="--shiki-light:#F35815;--shiki-dark:#F35815">=</span><span style="--shiki-light:#D92038;--shiki-dark:#FF7082"> 1</span></span>
<span class="line"><span style="--shiki-light:#F35815;--shiki-dark:#F35815">  AND</span><span style="--shiki-light:#F35815;--shiki-dark:#F35815"> block->></span><span style="--shiki-light:#13862E;--shiki-dark:#75DB8C">'_type'</span><span style="--shiki-light:#F35815;--shiki-dark:#F35815"> =</span><span style="--shiki-light:#13862E;--shiki-dark:#75DB8C"> 'block'</span></span>
<span class="line"><span style="--shiki-light:#F35815;--shiki-dark:#F35815">  AND</span><span style="--shiki-light:#F35815;--shiki-dark:#F35815"> block->></span><span style="--shiki-light:#13862E;--shiki-dark:#75DB8C">'style'</span><span style="--shiki-light:#F35815;--shiki-dark:#F35815"> IN</span><span style="--shiki-light:#2B2B2B;--shiki-dark:#E1E1E1"> (</span><span style="--shiki-light:#13862E;--shiki-dark:#75DB8C">'h2'</span><span style="--shiki-light:#2B2B2B;--shiki-dark:#E1E1E1">, </span><span style="--shiki-light:#13862E;--shiki-dark:#75DB8C">'h3'</span><span style="--shiki-light:#2B2B2B;--shiki-dark:#E1E1E1">);</span></span>
<span class="line"></span>
<span class="line"><span style="--shiki-light:#F35815;--shiki-dark:#F35815">+</span><span style="--shiki-light:#818181;--shiki-dark:#A1A1A1">----------------+</span></span>
<span class="line"><span style="--shiki-light:#2B2B2B;--shiki-dark:#E1E1E1">| pg_size_pretty |</span></span>
<span class="line"><span style="--shiki-light:#2B2B2B;--shiki-dark:#E1E1E1">|</span><span style="--shiki-light:#818181;--shiki-dark:#A1A1A1">----------------|</span></span>
<span class="line"><span style="--shiki-light:#2B2B2B;--shiki-dark:#E1E1E1">| </span><span style="--shiki-light:#D92038;--shiki-dark:#FF7082">5127</span><span style="--shiki-light:#2B2B2B;--shiki-dark:#E1E1E1"> bytes     |</span></span>
<span class="line"><span style="--shiki-light:#F35815;--shiki-dark:#F35815">+</span><span style="--shiki-light:#818181;--shiki-dark:#A1A1A1">----------------+</span></span>
<span class="line"></span></code></pre></div></div><p>Less data is smaller, big surprise!</p><p>This is useful information for this specific query, but measuring queries individually is tedious. Ideally, we want to monitor the size of every query generated by our application and see usage patterns over their lifetime. Fortunately, Insights does this for us.</p><h3 id="with-insights"><a href="https://planetscale.com/blog/database-egress#with-insights">With Insights</a></h3><p>PlanetScale Insights monitors the queries performed in your database. These statistics can be viewed in the dashboard and are made available to agents via the PlanetScale MCP server.</p><p>Often, developers use Insights to measure query latency to improve performance, but it also provides many other statistics, such as bytes returned.</p><p><picture class="block"><source media="(prefers-color-scheme: light), (prefers-color-scheme: no-preference)" srcSet="https://planetscale-images.imgix.net/assets/docs-shotter-light-2026-05-12T12-38-09-DlLWYzZQ.png?auto=compress%2Cformat"><source media="(prefers-color-scheme: dark)" srcSet="https://planetscale-images.imgix.net/assets/docs-shotter-light-2026-05-12T12-38-09-darkmode-CN3_nYvI.png?auto=compress%2Cformat"><img alt="Insights query list" src="https://planetscale-images.imgix.net/assets/docs-shotter-light-2026-05-12T12-38-09-DlLWYzZQ.png?auto=compress%2Cformat" width="2984" height="1858" loading="lazy"></picture></p><p>Open Insights and from the query list select the &quot;Data&quot; tab. These tabs contain preset columns relevant to debugging specific scenarios. Here we&#x27;ve sorted by &quot;Bytes returned per query&quot; and can see the largest transfer size of all queries in the currently selected time period.</p><p>Consider a query that returns 37 KB per call. Run 100 times, it transfers less than 4 MB and is probably not worth optimizing. Run 100,000 times, it transfers nearly 4 GB. Sort by the queries with the highest total bytes returned to find improvements which may have the most impact.</p><p>Look for frequently run, large-byte-transferred queries to identify opportunities for improvement.</p><h3 id="egress-and-ingress-metrics"><a href="https://planetscale.com/blog/database-egress#egress-and-ingress-metrics">Egress and ingress metrics</a></h3><p>For PlanetScale Postgres databases, the overall volume of egress and ingress can also be measured in the Metrics tab. At the bottom of this tab are graphs for ingress and egress.</p><p>From here, you can look for spikes that correlate with queries run at particular times to find any outliers.</p><p><picture class="block"><source media="(prefers-color-scheme: light), (prefers-color-scheme: no-preference)" srcSet="https://planetscale-images.imgix.net/assets/docs-shotter-light-2026-05-12T12-45-48-DbvX75et.png?auto=compress%2Cformat"><source media="(prefers-color-scheme: dark)" srcSet="https://planetscale-images.imgix.net/assets/docs-shotter-light-2026-05-12T12-45-48-darkmode-GuKJAtEd.png?auto=compress%2Cformat"><img alt="Metrics tab" src="https://planetscale-images.imgix.net/assets/docs-shotter-light-2026-05-12T12-45-48-DbvX75et.png?auto=compress%2Cformat" width="2984" height="1184" loading="lazy"></picture></p><p>Read more: <a href="https://planetscale.com/docs/postgres/monitoring/metrics">Metrics in the PlanetScale docs</a></p><h3 id="tagging-classes-of-queries"><a href="https://planetscale.com/blog/database-egress#tagging-classes-of-queries">Tagging classes of queries</a></h3><p>Additionally, on PlanetScale Postgres, if you know your application contains several related queries you&#x27;d like to monitor collectively for egress or performance, query tagging is a way to link them.</p><p>Query tags are added using the SQL Commenter format. By adding tags, for example, we can tag every query that requests or updates a row with <code>portable-text</code> so that we can measure all these queries together.</p><div class="code-block" data-language="sql"><div class="min-w-0 max-w-full"><pre class="shiki shiki-themes planetscale-light planetscale-dark" style="--shiki-light:#2b2b2b;--shiki-dark:#e1e1e1;--shiki-light-bg:#ebebeb;--shiki-dark-bg:#1a1a1a" tabindex="0"><code><span class="line"><span style="--shiki-light:#F35815;--shiki-dark:#F35815">SELECT</span></span>
<span class="line"><span style="--shiki-light:#2B2B2B;--shiki-dark:#E1E1E1">	id, content</span></span>
<span class="line"><span style="--shiki-light:#F35815;--shiki-dark:#F35815">FROM</span></span>
<span class="line"><span style="--shiki-light:#2B2B2B;--shiki-dark:#E1E1E1">	posts</span></span>
<span class="line"><span style="--shiki-light:#F35815;--shiki-dark:#F35815">LIMIT</span></span>
<span class="line"><span style="--shiki-light:#D92038;--shiki-dark:#FF7082">	10</span></span>
<span class="line"><span style="--shiki-light:#818181;--shiki-dark:#A1A1A1">/* returns='portable-text' */</span><span style="--shiki-light:#2B2B2B;--shiki-dark:#E1E1E1">;</span></span>
<span class="line"></span></code></pre></div></div><p>From the &quot;Tags&quot; page in the dashboard, we can now view queries with just this tag and measure their transfer sizes more cleanly.</p><p><picture class="block"><source media="(prefers-color-scheme: light), (prefers-color-scheme: no-preference)" srcSet="https://planetscale-images.imgix.net/assets/docs-shotter-light-2026-05-12T14-05-27-Cw1xzV9X.png?auto=compress%2Cformat"><source media="(prefers-color-scheme: dark)" srcSet="https://planetscale-images.imgix.net/assets/docs-shotter-light-2026-05-12T14-05-27-darkmode-D1F-AVIU.png?auto=compress%2Cformat"><img alt="Tags page" src="https://planetscale-images.imgix.net/assets/docs-shotter-light-2026-05-12T14-05-27-Cw1xzV9X.png?auto=compress%2Cformat" width="2984" height="1858" loading="lazy"></picture></p><p>Read more: <a href="https://planetscale.com/docs/postgres/monitoring/query-tags">Tags in the PlanetScale docs</a></p><h2 id="conclusion"><a href="https://planetscale.com/blog/database-egress#conclusion">Conclusion</a></h2><p>Don&#x27;t wait until things start getting expensive before thinking about egress. Optimizing early can result in more declarative queries, cleaner code, faster responses, and lower resource demands on your database.</p><p>Connect your agent to the <a href="https://planetscale.com/docs/mcp-server">PlanetScale MCP server</a> and prompt your agent to find opportunities to improve your application&#x27;s database egress usage.</p><blockquote><p>From the point of view of an application developer that understands efficient database usage patterns, interrogate our code base for examples where we are querying for columns of data that the application is not using, returning data from updates or inserts that we do not need, or improvements to reduce the frequency or quantity of queries performed for the same data. Read https://planetscale.com/blog/database-egress for more details.</p></blockquote>]]></content>
    <summary><![CDATA[Reducing the size and frequency of requests to your database has the double benefit of making your applications faster and cheaper.]]></summary>
  </entry>
  <entry>
    <title>Problem solving with PlanetScale Insights</title>
    <link href="https://planetscale.com/blog/problem-solving-with-insights"/>
    <id>https://planetscale.com/blog/problem-solving-with-insights</id>
    <published>2026-05-07T00:00:00.000Z</published>
    <updated>2026-05-07T00:00:00.000Z</updated>
    <author>
      <name>Simeon Griggs</name>
    </author>
    <category term="product"/>
    <content type="html"><![CDATA[<p>There are so many ways your database can disappoint you. It&#x27;ll make your application perform in ways you don&#x27;t expect and upset your users.</p><p>In a sufficiently complex application, finding and eliminating performance problems can be difficult. Fortunately, PlanetScale gives you the tools to isolate the problem. PlanetScale Insights, available in the dashboard and through the MCP server, provides accurate, up-to-date information on how the queries in your codebase perform in production.</p><p>But with so many different metrics available, how do you differentiate good numbers from bad, signal from noise, or know what the most likely fix is once you&#x27;ve pinned down the problem?</p><p>For this post, I&#x27;ll walk through exploring Query Insights for a demo e-commerce app connected to a PlanetScale Postgres PS-10 database with a few million rows of data. I set up a flow of constant, regular traffic along with a few &quot;unexpected&quot; spikes.</p><p>PlanetScale Insights also works for PlanetScale Vitess/MySQL databases and has many of the same features. This post focuses only on PlanetScale Postgres.</p><iframe allow="autoplay; fullscreen; picture-in-picture" src="https://www.youtube-nocookie.com/embed/OAPHvq51hWU?rel=0&color=white" title="Problem solving with PlanetScale Insights"></iframe><h2 id="latency-timeline-graph"><a href="https://planetscale.com/blog/problem-solving-with-insights#latency-timeline-graph">Latency timeline graph</a></h2><p><picture class="block"><source media="(prefers-color-scheme: light), (prefers-color-scheme: no-preference)" srcSet="https://planetscale-images.imgix.net/assets/docs-shotter-2026-04-20T11-06-11-arrow-BZ8YKpXp.png?auto=compress%2Cformat"><source media="(prefers-color-scheme: dark)" srcSet="https://planetscale-images.imgix.net/assets/docs-shotter-2026-04-20T11-06-11-arrow-darkmode-nbxpTHlE.png?auto=compress%2Cformat"><img alt="Insights dashboard" src="https://planetscale-images.imgix.net/assets/docs-shotter-2026-04-20T11-06-11-arrow-BZ8YKpXp.png?auto=compress%2Cformat" width="2984" height="1858" loading="lazy"></picture></p><p>The default view of the PlanetScale Insights dashboard shows query performance, counts, and row reads and writes for the past 24 hours. You can navigate through up to seven days&#x27; worth of traffic data.</p><p>Query latency is the best starting point for isolating query performance issues. You can toggle trend lines in the graph on and off; the query list below aligns with the same timeline.</p><p>On this page, latency percentiles are computed from all query pattern executions performed within the observable time window. How fast most runs are versus the slow tail. That is how you differentiate the median run (p50) versus the worst few percent (p99 and above).</p><ul><li><strong>p50:</strong> Half of this query&#x27;s executions complete faster than this value, half slower. This is the median latency for that pattern.</li><li><strong>p95:</strong> 95% of executions complete faster than this; only 1 in 20 are slower. This filter identifies patterns that occasionally misbehave, but tuning them often will not move <strong>overall</strong> database latency (for example, workload p50) very much.</li><li><strong>p99:</strong> 99% of executions complete faster than this; only 1 in 100 are slower. This is where gains can be made for that pattern&#x27;s worst runs.</li><li><strong>p99.9:</strong> Only 1 in 1,000 executions are slower. These are usually extreme outliers for that pattern: lock contention, cold caches, missing indexes, table scans, and similar.</li><li><strong>Max:</strong> The single slowest execution of this pattern in the time window. Useful for spotting worst-case scenarios, but a single anomaly can skew this number and may be related to an almost random event that never reoccurs. Always compare it against the percentiles above.</li></ul><p>For a deeper dive on <a href="https://youtu.be/AZD1D9gtB-A">understanding latency percentiles, watch Ben&#x27;s video</a>.</p><p><picture class="block"><source media="(prefers-color-scheme: light), (prefers-color-scheme: no-preference)" srcSet="https://planetscale-images.imgix.net/assets/docs-shotter-2026-04-20T11-06-11-cropped-1kfjJL8N.png?auto=compress%2Cformat"><source media="(prefers-color-scheme: dark)" srcSet="https://planetscale-images.imgix.net/assets/docs-shotter-2026-04-20T11-06-11-cropped-darkmode-Cqf3LwF6.png?auto=compress%2Cformat"><img alt="Insights dashboard" src="https://planetscale-images.imgix.net/assets/docs-shotter-2026-04-20T11-06-11-cropped-1kfjJL8N.png?auto=compress%2Cformat" width="2262" height="894" loading="lazy"></picture></p><p>Given this screenshot of Insights from my example application, the tabs at the top show that at 12:05 GMT+1 the p50 is 1.4ms and the p99 is 2s.</p><p>Point-in-time performance numbers can be useful, but execution trends over time matter much more to find real, unexpected outliers.</p><p>From the graph we can see the p99 is consistently far higher than the p50 and p95, with one huge spike where it got as high as 12s.</p><p>Generally, you may think that if &quot;only&quot; 1/100 queries are slow this latency may have a limited blast radius. But if a page load in your application triggers 10s or 100+ queries to your database the impact could be widespread and affect more users than you think.</p><p>These slower p99 queries we need to find and resolve. Let&#x27;s find the guilty parties.</p><h2 id="query-list"><a href="https://planetscale.com/blog/problem-solving-with-insights#query-list">Query list</a></h2><p>Below the latency graph, filtered to the same timeline, is a list of queries. From here, you can investigate the performance of each individual query that was run on your database at the same time. There are many columns of data you can read to investigate query performance. Which data is useful to you will depend on what you&#x27;re debugging.</p><p>If you&#x27;re not sure which numbers to look for, the tabs on the top right have preconfigured columns.</p><p>For example, if your database consistently shows high CPU usage, click the &quot;Resources&quot; tab to view CPU usage metrics. You can click any column to sort by that metric.</p><p>Since we&#x27;re looking to fix query latency, we&#x27;ll click the Performance preset and sort queries by <strong>p99 latency (ms)</strong>.</p><p><picture class="block"><source media="(prefers-color-scheme: light), (prefers-color-scheme: no-preference)" srcSet="https://planetscale-images.imgix.net/assets/docs-shotter-2026-04-30T12-40-18-CcvK-J7Y.png?auto=compress%2Cformat"><source media="(prefers-color-scheme: dark)" srcSet="https://planetscale-images.imgix.net/assets/docs-shotter-2026-04-30T12-40-18-darkmode-D2xxi8Qe.png?auto=compress%2Cformat"><img alt="Insights dashboard showing list of slow queries" src="https://planetscale-images.imgix.net/assets/docs-shotter-2026-04-30T12-40-18-CcvK-J7Y.png?auto=compress%2Cformat" width="2984" height="1858" loading="lazy"></picture></p><p>Note that the Performance preset also includes the &quot;Rows read/returned&quot; column; this is often the simplest identifier of slow queries. It contrasts <strong>rows the engine had to read</strong> with <strong>rows actually returned</strong>—when reads are high but returns are low, the database is doing a lot of work per useful row, often because of missing or unsuitable indexes. Most often, these queries can be fixed with an index.</p><p>Solving the response time issues for some of these queries will be simpler than for others. A number of these queries have a little <code>(i)</code> information icon beside them showing that the queries are being performed without an index and may benefit from one.</p><p>(It&#x27;s also worth noting that some of these queries are slow because they&#x27;re <em>deliberately</em> bad queries. I needed an exceptionally unoptimized application for this blog post. So, for example, we&#x27;re not going to &quot;fix&quot; a query for a random product ID.)</p><h3 id="searching-for-queries"><a href="https://planetscale.com/blog/problem-solving-with-insights#searching-for-queries">Searching for queries</a></h3><p>The search box above the query list lets you perform targeted searches for specific queries. You may write part of an SQL query in this box, but there are additional search syntaxes to query by feature, latency, tag, or more. Examples include:</p><ul><li><code>indexed:false</code> — find all queries not using an index</li><li><code>index:table_name.index_name</code> — find all queries using a specific index</li><li><code>p50:&gt;250</code> — filter by latency threshold</li><li><code>query_count:&gt;1000</code> — filter by execution count</li><li><code>tag:key:value</code> — filter by tag</li></ul><p>Clicking the <code>SYNTAX</code> button on the right side of the search box reveals the full set of filters you can use to narrow down your query filtering.</p><h3 id="other-graphs"><a href="https://planetscale.com/blog/problem-solving-with-insights#other-graphs">Other graphs</a></h3><p>Along with Query latency there are graphs to show other activity trends in your database.</p><p><picture class="block"><source media="(prefers-color-scheme: light), (prefers-color-scheme: no-preference)" srcSet="https://planetscale-images.imgix.net/assets/docs-shotter-2026-04-30T13-11-59-JSA1sHX3.png?auto=compress%2Cformat"><source media="(prefers-color-scheme: dark)" srcSet="https://planetscale-images.imgix.net/assets/docs-shotter-2026-04-30T13-11-59-darkmode-BdAYuRep.png?auto=compress%2Cformat"><img alt="Queries graph tab" src="https://planetscale-images.imgix.net/assets/docs-shotter-2026-04-30T13-11-59-JSA1sHX3.png?auto=compress%2Cformat" width="2416" height="1471" loading="lazy"></picture></p><p>The <strong>Queries</strong> tab shows total queries per second over time. If latency rises at the same time as query volume, you may be looking at a traffic spike rather than a single query pattern getting worse.</p><p>The <strong>Rows read</strong> tab shows how many rows the database reads per second. High rows read, especially compared to rows returned in the query list, can indicate that the database is reading unnecessary rows and may benefit from a better index.</p><p>The <strong>Rows written</strong> tab shows rows written per second over the selected time period. It gives you a separate view of write volume alongside query latency, query count, and rows read.</p><h2 id="query-details"><a href="https://planetscale.com/blog/problem-solving-with-insights#query-details">Query details</a></h2><p>Let&#x27;s click in to look at an individual query and what Insights can tell us.</p><p>If your application writes raw, sensible SQL, your query might look as simple as this:</p><p><picture class="block"><source media="(prefers-color-scheme: light), (prefers-color-scheme: no-preference)" srcSet="https://planetscale-images.imgix.net/assets/docs-shotter-2026-04-20T09-00-28-DW7rqGoR.png?auto=compress%2Cformat"><source media="(prefers-color-scheme: dark)" srcSet="https://planetscale-images.imgix.net/assets/docs-shotter-2026-04-20T09-00-28-darkmode-B8cWr3DZ.png?auto=compress%2Cformat"><img alt="Insights query details page" src="https://planetscale-images.imgix.net/assets/docs-shotter-2026-04-20T09-00-28-DW7rqGoR.png?auto=compress%2Cformat" width="2984" height="1858" loading="lazy"></picture></p><p>If you&#x27;re using an ORM, your query could be incomprehensible at first glance. Fortunately, the &quot;Summarize query&quot; button runs the query pattern through an LLM to describe its purpose in plain English.</p><p>You may also notice the query has been anonymized. Because parameters in a query may contain sensitive information, they&#x27;re replaced with placeholders when logged in to Insights. In this instance, the search term <code>%turbo%</code> is rendered as the parameter <code>$1</code>, but it is not visible in Insights.</p><p>The page of a query pattern also contains a table of <strong>notable queries</strong>, individual executions that took longer than 1 second, read more than 10,000 rows, or produced an error. This could help determine whether your query is not always slow and perhaps reveal a common time when it runs slower than normal.</p><h3 id="taking-action-on-a-query"><a href="https://planetscale.com/blog/problem-solving-with-insights#taking-action-on-a-query">Taking action on a query</a></h3><p>On this page, you can see the same performance graphs as the query list page, but isolated to just this one query. In this screenshot, we see a recommendation from Insights to add an index if the performance is poor. A lot of the time, this is a great idea.</p><p>Unfortunately, because this query is using a wildcard search, a BTREE index won&#x27;t help.</p><p>If the query were simpler, like below, an index on the <code>name</code> column would greatly improve performance.</p><div class="code-block" data-language="SQL"><div class="min-w-0 max-w-full"><pre class="shiki shiki-themes planetscale-light planetscale-dark" style="--shiki-light:#2b2b2b;--shiki-dark:#e1e1e1;--shiki-light-bg:#ebebeb;--shiki-dark-bg:#1a1a1a" tabindex="0"><code><span class="line"><span style="--shiki-light:#F35815;--shiki-dark:#F35815">select</span><span style="--shiki-light:#0B6EC5;--shiki-dark:#73C7F9"> count</span><span style="--shiki-light:#2B2B2B;--shiki-dark:#E1E1E1">(</span><span style="--shiki-light:#F35815;--shiki-dark:#F35815">*</span><span style="--shiki-light:#2B2B2B;--shiki-dark:#E1E1E1">) </span><span style="--shiki-light:#F35815;--shiki-dark:#F35815">as</span><span style="--shiki-light:#2B2B2B;--shiki-dark:#E1E1E1"> count </span><span style="--shiki-light:#F35815;--shiki-dark:#F35815">from</span><span style="--shiki-light:#2B2B2B;--shiki-dark:#E1E1E1"> products </span><span style="--shiki-light:#F35815;--shiki-dark:#F35815">where</span><span style="--shiki-light:#F35815;--shiki-dark:#F35815"> name</span><span style="--shiki-light:#F35815;--shiki-dark:#F35815"> =</span><span style="--shiki-light:#13862E;--shiki-dark:#75DB8C"> 'turbo'</span><span style="--shiki-light:#2B2B2B;--shiki-dark:#E1E1E1">;</span></span>
<span class="line"></span></code></pre></div></div><p>Instead, we may be better off with a GIN trigram index, as they are better designed for wildcard searches. Fortunately, <code>pg_trgm</code> is a supported extension in PlanetScale Postgres, so I was able to experiment with it. It improved query performance, but only slightly.</p><p>Often, an index can fix a slow query. Other times, slow queries reveal bad schema or application design. Both are important to resolve; the latter is just a little more complicated, as you may need to rip and replace the query in order to improve application performance.</p><blockquote><p>The most common mistake of a smart engineer is to optimize a thing that should not exist</p></blockquote><p><picture class="block"><source media="(prefers-color-scheme: light), (prefers-color-scheme: no-preference)" srcSet="https://planetscale-images.imgix.net/assets/docs-shotter-2026-04-30T12-47-52-Bd0PdCsM.png?auto=compress%2Cformat"><source media="(prefers-color-scheme: dark)" srcSet="https://planetscale-images.imgix.net/assets/docs-shotter-2026-04-30T12-47-52-darkmode-CHIGwf_b.png?auto=compress%2Cformat"><img alt="Insights query details index use" src="https://planetscale-images.imgix.net/assets/docs-shotter-2026-04-30T12-47-52-Bd0PdCsM.png?auto=compress%2Cformat" width="2984" height="1858" loading="lazy"></picture></p><p>If the selected query is using indexes, statistics are shown below the latency graphs, along with tags attached to that query (<a href="https://planetscale.com/blog/problem-solving-with-insights#grouping-queries-with-tags">more in the section below</a>).</p><h2 id="insights-mcp"><a href="https://planetscale.com/blog/problem-solving-with-insights#insights-mcp">Insights MCP</a></h2><p>Fortunately, there&#x27;s never been a better time to fix complex problems.</p><p>The <a href="https://planetscale.com/docs/mcp-server">PlanetScale MCP server</a> has access to the same data you&#x27;re able to browse in the dashboard. This means you can task an agent with finding and suggesting fixes for slow queries within your codebase. With your application as its context and real-world production data available via tool calls to Insights, you no longer have excuses for slow database queries.</p><p>At PlanetScale, we have workflows configured to do this daily. See the video below for more details.</p><iframe allow="autoplay; fullscreen; picture-in-picture" src="https://www.youtube-nocookie.com/embed/T7aof_ilvkQ?rel=0&color=white" title="The self-improving database has arrived"></iframe><p>In the case of our slow query that can&#x27;t be fixed with an index, this is a great job for an agent. It can not only read Insights data but also perform queries on its own. While experimenting with indexes on this database, I observed the agent reading the output of <code>EXPLAIN ANALYZE</code> to ensure the index was being used and to report the impact on results.</p><p>Consider a prompt something like:</p><blockquote><p>I need you to help resolve a slow database query in this application. Make suggestions on whether we can resolve this by adding an index. If so, let&#x27;s test the results before and after. Additionally, we may need to rethink the query and consider whether there are more efficient ways to obtain the same data to improve application performance.</p></blockquote><p>To help keep your agent focused, include the details of the PlanetScale database in your application&#x27;s <code>AGENTS.md</code>, for example:</p><div class="code-block" data-language="markdown"><div class="min-w-0 max-w-full"><pre class="shiki shiki-themes planetscale-light planetscale-dark" style="--shiki-light:#2b2b2b;--shiki-dark:#e1e1e1;--shiki-light-bg:#ebebeb;--shiki-dark-bg:#1a1a1a" tabindex="0"><code><span class="line"><span style="--shiki-light:#616161;--shiki-light-font-weight:bold;--shiki-dark:#C1C1C1;--shiki-dark-font-weight:bold">##</span><span style="--shiki-light:#F35815;--shiki-light-font-weight:bold;--shiki-dark:#F35815;--shiki-dark-font-weight:bold"> PlanetScale</span></span>
<span class="line"></span>
<span class="line"><span style="--shiki-light:#A78103;--shiki-dark:#F2B600">-</span><span style="--shiki-light:#2B2B2B;--shiki-dark:#E1E1E1"> Organization: ready-set-go</span></span>
<span class="line"><span style="--shiki-light:#A78103;--shiki-dark:#F2B600">-</span><span style="--shiki-light:#2B2B2B;--shiki-dark:#E1E1E1"> Database: tutorial-insights</span></span>
<span class="line"><span style="--shiki-light:#A78103;--shiki-dark:#F2B600">-</span><span style="--shiki-light:#2B2B2B;--shiki-dark:#E1E1E1"> Branch: main</span></span>
<span class="line"></span></code></pre></div></div><div class="mb-3 border p-3 border-blue-600 dark:border-blue-500"><p><span class="bg-blue-600 px-sm text-white dark:bg-blue-500 dark:text-black">Note</span></p><p>MCP permissions are set when you authenticate the server. It is not advised to give an agent write access to your production database.</p></div><h2 id="grouping-queries-with-tags"><a href="https://planetscale.com/blog/problem-solving-with-insights#grouping-queries-with-tags">Grouping queries with tags</a></h2><p>So far, we&#x27;ve looked at identifying queries by grouping together the slow ones. There are other reasons to group queries together, though, which can help with debugging as well as improve performance.</p><p>On the <strong>Tags</strong> page, we can see queries grouped by metadata related to them. There are built-in key-value pairs, such as the application name and remote address of the connection that ran the query.</p><p>Custom metadata can be included with queries as SQLCommenter comments. Not all ORMs support comments; check your documentation if you are not writing raw SQL.</p><div class="code-block" data-language="SQL"><div class="min-w-0 max-w-full"><pre class="shiki shiki-themes planetscale-light planetscale-dark" style="--shiki-light:#2b2b2b;--shiki-dark:#e1e1e1;--shiki-light-bg:#ebebeb;--shiki-dark-bg:#1a1a1a" tabindex="0"><code><span class="line"><span style="--shiki-light:#F35815;--shiki-dark:#F35815">select</span><span style="--shiki-light:#0B6EC5;--shiki-dark:#73C7F9"> count</span><span style="--shiki-light:#2B2B2B;--shiki-dark:#E1E1E1">(</span><span style="--shiki-light:#F35815;--shiki-dark:#F35815">*</span><span style="--shiki-light:#2B2B2B;--shiki-dark:#E1E1E1">) </span><span style="--shiki-light:#F35815;--shiki-dark:#F35815">as</span><span style="--shiki-light:#2B2B2B;--shiki-dark:#E1E1E1"> count </span><span style="--shiki-light:#F35815;--shiki-dark:#F35815">from</span><span style="--shiki-light:#2B2B2B;--shiki-dark:#E1E1E1"> products </span><span style="--shiki-light:#F35815;--shiki-dark:#F35815">where</span><span style="--shiki-light:#F35815;--shiki-dark:#F35815"> name</span><span style="--shiki-light:#2B2B2B;--shiki-dark:#E1E1E1"> ilike </span><span style="--shiki-light:#13862E;--shiki-dark:#75DB8C">'%turbo%'</span></span>
<span class="line"><span style="--shiki-light:#818181;--shiki-dark:#A1A1A1">/* application='store', action='search' */</span><span style="--shiki-light:#2B2B2B;--shiki-dark:#E1E1E1">;</span></span>
<span class="line"></span></code></pre></div></div><p>These comments are then logged as key-value pairs as queries are performed, allowing you to investigate the performance of a specific subset of queries based on their application, intention, and more.</p><p>So if you&#x27;re not debugging &quot;why is this query slow,&quot; but instead &quot;why is this section of the application slow,&quot; you might benefit from grouping that section&#x27;s queries with the same tag.</p><p>For more on tags, see <a href="https://planetscale.com/blog/enhanced-tagging-in-postgres-query-insights">Enhanced tagging in Postgres Query Insights</a>.</p><p>Tags are also the backbone of Traffic Control, the killer app of PlanetScale Postgres.</p><h2 id="traffic-control"><a href="https://planetscale.com/blog/problem-solving-with-insights#traffic-control">Traffic Control</a></h2><p>Some slow queries are unavoidable. We&#x27;ve already determined that our application has a slow query that can&#x27;t be easily fixed with an index. One option is to remove it entirely in favor of something else. An alluring third option is to put controls on how many resources the query can actually use.</p><p>Traffic Control allows you to do just that. Where timeouts in Postgres can be used as a blunt instrument to stop queries running over a certain time, Traffic Control gives you fine-grained control over how many resources a query can consume, as well as controls over concurrency and more. Perhaps our slow search query actually only runs from an admin panel.</p><p>So it&#x27;s less of a concern that a single query is slow, but more of a concern if multiple administrators run it concurrently and bring down the database&#x27;s performance.</p><p>The same tags we applied to observe a category of query behavior can have &quot;resource budgets&quot; applied to them to limit the amount of resources they are permitted to consume.</p><p>Insights now identifies slow queries, recommends improvements, and controls whether they can run at all.</p><p>See more in the <a href="https://planetscale.com/docs/postgres/traffic-control">Traffic Control documentation</a>.</p><h2 id="continual-improvement"><a href="https://planetscale.com/blog/problem-solving-with-insights#continual-improvement">Continual improvement</a></h2><p>So far, we&#x27;ve covered manual performance investigation. You and your agent are digging through Insights for improvements. As your application runs, Insights also gathers its own data on anomalous behavior and preemptively suggests upgrades.</p><p><picture class="block"><source media="(prefers-color-scheme: light), (prefers-color-scheme: no-preference)" srcSet="https://planetscale-images.imgix.net/assets/docs-shotter-2026-04-20T12-38-16-B9EdWfgi.png?auto=compress%2Cformat"><source media="(prefers-color-scheme: dark)" srcSet="https://planetscale-images.imgix.net/assets/docs-shotter-2026-04-20T12-38-16-darkmode-BDoSyKlp.png?auto=compress%2Cformat"><img alt="Insights anomalies page" src="https://planetscale-images.imgix.net/assets/docs-shotter-2026-04-20T12-38-16-B9EdWfgi.png?auto=compress%2Cformat" width="2984" height="1858" loading="lazy"></picture></p><p>The <strong>Anomalies</strong> page highlights when database performance is well outside the expected range. This can reveal unexpected query patterns, traffic spikes, or other problems with your database.</p><p>If you have an anomaly in your Insights dashboard, you can click in to see more details about the time of the anomaly and which queries contributed to it. Match this timeframe against any other application logging platforms you have to identify the root cause. It could be an unexpected one-time outlier, or it could be the result of recently updated application code, and is likely to repeat.</p><p><a href="https://planetscale.com/docs/vitess/monitoring/anomalies">Learn more in the Anomalies documentation</a>.</p><p>Insights also monitors traffic to regularly produce schema recommendations. These may include the index suggestion we saw earlier, or other helpful tips to potentially improve the health of your database.</p><p>Recommendations typically include SQL statements you can run in your database to take action.</p><p>Both the <strong>Anomalies</strong> and <strong>Recommendations</strong> data found within Insights are available from the PlanetScale MCP server if you would like an Agent to help you decide whether to take action on the database.</p><p><picture class="block"><source media="(prefers-color-scheme: light), (prefers-color-scheme: no-preference)" srcSet="https://planetscale-images.imgix.net/assets/docs-shotter-2026-04-20T13-20-14-CvuoVO5O.png?auto=compress%2Cformat"><source media="(prefers-color-scheme: dark)" srcSet="https://planetscale-images.imgix.net/assets/docs-shotter-2026-04-20T13-20-14-darkmode-o0ejSj1e.png?auto=compress%2Cformat"><img alt="Insights recommendations page" src="https://planetscale-images.imgix.net/assets/docs-shotter-2026-04-20T13-20-14-CvuoVO5O.png?auto=compress%2Cformat" width="2984" height="1858" loading="lazy"></picture></p><h2 id="error-tracking"><a href="https://planetscale.com/blog/problem-solving-with-insights#error-tracking">Error tracking</a></h2><p>Slow queries aren&#x27;t the only problem Insights can surface. The <strong>Errors</strong> page captures every database error from the past 24 hours and plots them on a timeline, letting you spot patterns you&#x27;d otherwise miss in application logs.</p><p><picture class="block"><source media="(prefers-color-scheme: light), (prefers-color-scheme: no-preference)" srcSet="https://planetscale-images.imgix.net/assets/docs-shotter-2026-04-22T14-14-08-3DHZXUiz.png?auto=compress%2Cformat"><source media="(prefers-color-scheme: dark)" srcSet="https://planetscale-images.imgix.net/assets/docs-shotter-2026-04-22T14-14-08-darkmode-BVrmw1FN.png?auto=compress%2Cformat"><img alt="Insights errors page showing duplicate key constraint violations" src="https://planetscale-images.imgix.net/assets/docs-shotter-2026-04-22T14-14-08-3DHZXUiz.png?auto=compress%2Cformat" width="2984" height="1858" loading="lazy"></picture></p><p>In my demo store, I simulated a retry storm during checkout — a flaky network that caused the same order to be submitted multiple times with the same idempotency key. The errors tab immediately surfaced the <code>duplicate key value violates unique constraint</code> message on the <code>orders_idempotency_key_key</code> index. Clicking into it revealed each occurrence: the exact query, when it ran, how long it took, and the tags I&#x27;d attached to identify the <code>checkout</code> action. From there, I could see the errors clustered in tight bursts, a telltale sign of retries hitting the same unique constraint rather than a systemic problem.</p><p>This is the kind of issue that often goes unnoticed. The application catches the exception, retries successfully, and the user never sees a failure — but the database is doing unnecessary work. The Errors page makes these invisible problems visible.</p><h2 id="conclusion"><a href="https://planetscale.com/blog/problem-solving-with-insights#conclusion">Conclusion</a></h2><p>PlanetScale Insights is the best way to see how your database actually performs in production, providing you and your agents with the metrics that matter to improve your database schema, queries, or completely change access patterns.</p><p>In a future article, we&#x27;ll look at how to inspect common database problems by viewing specific metrics in Insights. If there&#x27;s an issue with your queries you can&#x27;t yet get to the bottom of, <a href="https://planetscale.com/contact">let us know</a>!</p>]]></content>
    <summary><![CDATA[The best way for you and your agents to see how your database actually performs in production.]]></summary>
  </entry>
  <entry>
    <title>On benchmarking</title>
    <link href="https://planetscale.com/blog/on-benchmarking"/>
    <id>https://planetscale.com/blog/on-benchmarking</id>
    <published>2026-05-05T00:00:00.000Z</published>
    <updated>2026-05-05T00:00:00.000Z</updated>
    <author>
      <name>Ben Dicken</name>
    </author>
    <category term="engineering"/>
    <content type="html"><![CDATA[<p>Benchmarking is hard. There are many ways to do it wrong and few to do it right.</p><p>But zooming out from any single system or harness, there are broad principles that should be applied to all benchmarking. Using these correctly makes it difficult to produce biased results.</p><p>Am I the world&#x27;s best benchmarker? Certainly not. I invented the <a href="https://x.com/BenjDicken/status/1861072804239847914">language balls</a>, after all. But correctness and precision are important parts of PlanetScale&#x27;s culture. We&#x27;ve spent considerable time learning the art of benchmarking, and are here to share best-practices.</p><p>Here, we&#x27;re focusing primarily on benchmarking <em>databases</em>, but these principles apply to many domains.</p><h2 id="client-server-architecture"><a href="https://planetscale.com/blog/on-benchmarking#client-server-architecture">Client-server architecture</a></h2><p>Databases typically operate in a client-server model. The database server is started, accepts connections from clients, executes queries, and returns results.</p><p>To benchmark, we need a client that establishes the connections, generates queries, and takes measurements. Since both sides consume resources and we want to give the <em>database</em> its full share of the host server, it&#x27;s common to set up a distinct server for benchmark execution.</p><p>As usual, <em>there&#x27;s a catch</em>. This introduces latency between the two machines.</p><p><picture class="block"><source media="(prefers-color-scheme: light), (prefers-color-scheme: no-preference)" srcSet="https://planetscale-images.imgix.net/assets/client-server-DSv7LBqp.png?auto=compress%2Cformat"><source media="(prefers-color-scheme: dark)" srcSet="https://planetscale-images.imgix.net/assets/client-server-darkmode-l5yZMo25.png?auto=compress%2Cformat"><img alt="Client-server" src="https://planetscale-images.imgix.net/assets/client-server-DSv7LBqp.png?auto=compress%2Cformat" width="2400" height="1880" loading="lazy"></picture></p><p>How much this skews the results of the benchmark depends quite a bit on how &quot;far apart&quot; the benchmark server and database server are (network latency) and how long the queries / transactions take on the database (execution latency).</p><p><picture class="block"><source media="(prefers-color-scheme: light), (prefers-color-scheme: no-preference)" srcSet="https://planetscale-images.imgix.net/assets/network-latency-execution-latency-D7jzvLOo.png?auto=compress%2Cformat"><source media="(prefers-color-scheme: dark)" srcSet="https://planetscale-images.imgix.net/assets/network-latency-execution-latency-darkmode-DonplkLE.png?auto=compress%2Cformat"><img alt="Network latency and execution latency" src="https://planetscale-images.imgix.net/assets/network-latency-execution-latency-D7jzvLOo.png?auto=compress%2Cformat" width="3256" height="1444" loading="lazy"></picture></p><p>Let&#x27;s consider a scenario where each query takes ~10ms to execute on the database. If the network round-trip time is 2.5 milliseconds, then we can execute approximately 80 queries per second over a single connection. On the other hand, what if the round-trip is 15 milliseconds? We&#x27;ve now cut our single-threaded QPS capability in ~half, resulting in 40 QPS.</p><p><picture class="block"><source media="(prefers-color-scheme: light), (prefers-color-scheme: no-preference)" srcSet="https://planetscale-images.imgix.net/assets/network-latency-difference-C_4xTSar.png?auto=compress%2Cformat"><source media="(prefers-color-scheme: dark)" srcSet="https://planetscale-images.imgix.net/assets/network-latency-difference-darkmode-CTYmZVN1.png?auto=compress%2Cformat"><img alt="How network latency impacts throughput" src="https://planetscale-images.imgix.net/assets/network-latency-difference-C_4xTSar.png?auto=compress%2Cformat" width="3288" height="1404" loading="lazy"></picture></p><p>Same database. Same benchmark client. The only difference is the speed at which bytes can go over the wire between the two.</p><p>This latency variation will always have an impact on latency measurements.</p><p>It <em>can</em> also impact throughput. We often don&#x27;t run benchmarks on a single connection. We&#x27;ll do 10, 50, or 100 simultaneous connections to best utilize the parallelism of the machine and database. But if we have a fixed connection count, and are not making it dynamic to account for round-trip latency, we can end up allowing the elevated latency to hurt throughput.</p><p>Finally, you should double-check that the client server is not a bottleneck. While benchmarking, ensure that CPU and network utilization are well under their capacity. We want to be straining the database server, not the client.</p><h2 id="choosing-resources"><a href="https://planetscale.com/blog/on-benchmarking#choosing-resources">Choosing resources</a></h2><p>It&#x27;s easy to make one database look better than another with an imbalance of resources. Postgres running on a 16-core server will almost always perform better than on an 8-core server.</p><p>An important prerequisite to proper benchmarking is setting up the compute, storage, and networking resources to allow for a fair fight.</p><p>This isn&#x27;t as easy as it sounds, especially when we&#x27;re talking about running things in the hyperscaler clouds like AWS and GCP. For example, the Geekbench results for an AWS <a href="https://browser.geekbench.com/v6/cpu/2119560">r7g.2xlarge</a> are ~15% lower than the results for an <a href="https://browser.geekbench.com/v6/cpu/11335856">r8g.2xlarge</a>. Both have 8 vCPUs and 64 GB RAM. But move one generation newer, and there&#x27;s a ~15% CPU improvement.</p><p><picture class="block"><source media="(prefers-color-scheme: light), (prefers-color-scheme: no-preference)" srcSet="https://planetscale-images.imgix.net/assets/geekbench-DFb0s8q0.png?auto=compress%2Cformat"><source media="(prefers-color-scheme: dark)" srcSet="https://planetscale-images.imgix.net/assets/geekbench-darkmode-zAs-8HQc.png?auto=compress%2Cformat"><img alt="Geekbench results" src="https://planetscale-images.imgix.net/assets/geekbench-DFb0s8q0.png?auto=compress%2Cformat" width="2000" height="1264" loading="lazy"></picture></p><p>You might then be tempted to just use the same instance for everything, but this breaks down too. The availability of instance types varies over time, region, and database provider. In some cases, it&#x27;s not possible to match.</p><p>In an ideal world, we&#x27;d run everything on the <em>exact</em> same instance. In reality, we sometimes have to settle for matching CPUs and RAM as best we can, and living with the differences. However, you must give this your best effort. Purposefully choosing to benchmark <em>your</em> product on 2025-gen CPU and then comparing to a competitor&#x27;s product on a 2022 CPU, when the alternate was readily available, is intentionally misleading.</p><h2 id="workload"><a href="https://planetscale.com/blog/on-benchmarking#workload">Workload</a></h2><p>Even once we know that our infrastructure is set up sanely, there&#x27;s a lot to consider for the workload we run.</p><p>The easiest way to think about this is in terms of traffic ratios.</p><ul><li>How many queries are hitting RAM vs disk?</li><li>What % of the data is hot (frequently queried) vs cold (rarely queried)?</li><li>What&#x27;s the ratio of reads to writes?</li></ul><p>All of these impact performance, especially when combined with the variations of underlying hardware.</p><p>Queries executed on a relational database often require some amount of I/O work. Writing data must always be persisted to disk. <em>Reading</em> data can come from the in-memory cache, or disk on cache misses.</p><p><picture class="block"><source media="(prefers-color-scheme: light), (prefers-color-scheme: no-preference)" srcSet="https://planetscale-images.imgix.net/assets/ram-disk-B91Wyn3l.png?auto=compress%2Cformat"><source media="(prefers-color-scheme: dark)" srcSet="https://planetscale-images.imgix.net/assets/ram-disk-darkmode-BsqMcUR2.png?auto=compress%2Cformat"><img alt="RAM, disk latency" src="https://planetscale-images.imgix.net/assets/ram-disk-B91Wyn3l.png?auto=compress%2Cformat" width="2400" height="1352" loading="lazy"></picture></p><p>Some databases operate on local SSDs, while others use network-attached storage like AWS EBS or Google Persistent Disk. Some even take a hybrid approach. Either way, the percent of read traffic hitting RAM vs disk impacts performance due to I/O wait times.</p><p>Consider a benchmark like <a href="https://github.com/akopytov/sysbench/blob/master/src/lua/oltp_read_only.lua">sysbench OLTP read-only</a>. This is a simple, read-only benchmark that runs a handful of select query patterns repeatedly. As benchmarks often do, the data size is configurable in the preparation phase. If we run this benchmark on a server with 64 GB of RAM and a 32 GB data size, the entire data set will fit in RAM after warming. The same benchmark run with a 320 GB data size will generate significant I/O and inevitably run slower.</p><p>This is related to, but not the same as, data distribution.</p><p>Even for a fixed data size, access patterns can vary widely. The simplest examples are uniform and Zipfian.</p><p><picture class="block"><source media="(prefers-color-scheme: light), (prefers-color-scheme: no-preference)" srcSet="https://planetscale-images.imgix.net/assets/distributions-DHT64hC8.png?auto=compress%2Cformat"><source media="(prefers-color-scheme: dark)" srcSet="https://planetscale-images.imgix.net/assets/distributions-darkmode-Bgx07A5I.png?auto=compress%2Cformat"><img alt="Types of data distributions" src="https://planetscale-images.imgix.net/assets/distributions-DHT64hC8.png?auto=compress%2Cformat" width="2252" height="1256" loading="lazy"></picture></p><p>A <em>uniform</em> access pattern gives every row the same chance of being queried on each request. If we have 100 rows, each has a 1% chance of being read for each operation.</p><p>A <em>Zipfian</em> access pattern is skewed: the k-th most popular key is accessed roughly proportional to <code>1/k</code>. A small number of hot rows receive a large share of requests, while most rows are accessed rarely.</p><p>These are only simple models. Real workloads often have messier shapes: recently inserted rows might be hotter than old rows, one tenant might dominate traffic, or a small working set might receive most reads for a period of time.</p><p>Which pattern the benchmark operates with significantly impacts performance, because it in turn impacts how frequently we need to access disk vs RAM and the amount of cache churn.</p><h2 id="closed-and-open-loop"><a href="https://planetscale.com/blog/on-benchmarking#closed-and-open-loop">Closed and open loop</a></h2><p>There are two types of benchmark workload shapes: open and closed loops.</p><p>In a closed-loop benchmark, the client sends requests and then waits for a response before sending the next.</p><div class="code-block" data-language="python"><div class="min-w-0 max-w-full"><pre class="shiki shiki-themes planetscale-light planetscale-dark" style="--shiki-light:#2b2b2b;--shiki-dark:#e1e1e1;--shiki-light-bg:#ebebeb;--shiki-dark-bg:#1a1a1a" tabindex="0"><code><span class="line"><span style="--shiki-light:#F35815;--shiki-dark:#F35815">while</span><span style="--shiki-light:#7D5903;--shiki-dark:#FED54A"> True</span><span style="--shiki-light:#616161;--shiki-dark:#C1C1C1">:</span></span>
<span class="line"><span style="--shiki-light:#818181;--shiki-dark:#A1A1A1">    # wait for response</span></span>
<span class="line"><span style="--shiki-light:#2B2B2B;--shiki-dark:#E1E1E1">    response </span><span style="--shiki-light:#F35815;--shiki-dark:#F35815">=</span><span style="--shiki-light:#0B6EC5;--shiki-dark:#73C7F9"> send_bench_request</span><span style="--shiki-light:#616161;--shiki-dark:#C1C1C1">()</span></span>
<span class="line"><span style="--shiki-light:#818181;--shiki-dark:#A1A1A1">    # then send next</span></span>
<span class="line"><span style="--shiki-light:#0B6EC5;--shiki-dark:#73C7F9">    process</span><span style="--shiki-light:#616161;--shiki-dark:#C1C1C1">(</span><span style="--shiki-light:#0B6EC5;--shiki-dark:#73C7F9">response</span><span style="--shiki-light:#616161;--shiki-dark:#C1C1C1">)</span></span>
<span class="line"></span></code></pre></div></div><p>We may do this in parallel across many connections, but each individual connection sends a controlled sequence of queries. A closed loop can also hide a failure mode called coordinated omission: when the database stalls, the client stops issuing new requests too, so the benchmark only records the stalled request and omits the work that would have queued behind it. This is especially misleading for tail latency, where the missing queued requests are exactly the ones that would have made p95/p99 look worse (more on latency and percentiles soon).</p><p>Open loop on the other hand has a fixed pace of sending requests, regardless of how quickly the database responds.</p><div class="code-block" data-language="python"><div class="min-w-0 max-w-full"><pre class="shiki shiki-themes planetscale-light planetscale-dark" style="--shiki-light:#2b2b2b;--shiki-dark:#e1e1e1;--shiki-light-bg:#ebebeb;--shiki-dark-bg:#1a1a1a" tabindex="0"><code><span class="line"><span style="--shiki-light:#F35815;--shiki-dark:#F35815">while</span><span style="--shiki-light:#7D5903;--shiki-dark:#FED54A"> True</span><span style="--shiki-light:#616161;--shiki-dark:#C1C1C1">:</span></span>
<span class="line"><span style="--shiki-light:#818181;--shiki-dark:#A1A1A1">    # fire and forget</span></span>
<span class="line"><span style="--shiki-light:#0B6EC5;--shiki-dark:#73C7F9">    send_bench_request</span><span style="--shiki-light:#616161;--shiki-dark:#C1C1C1">()</span></span>
<span class="line"><span style="--shiki-light:#818181;--shiki-dark:#A1A1A1">    # fixed pace</span></span>
<span class="line"><span style="--shiki-light:#2B2B2B;--shiki-dark:#E1E1E1">    time</span><span style="--shiki-light:#616161;--shiki-dark:#C1C1C1">.</span><span style="--shiki-light:#0B6EC5;--shiki-dark:#73C7F9">sleep</span><span style="--shiki-light:#616161;--shiki-dark:#C1C1C1">(</span><span style="--shiki-light:#D92038;--shiki-dark:#FF7082">0.1</span><span style="--shiki-light:#616161;--shiki-dark:#C1C1C1">)</span></span>
<span class="line"></span></code></pre></div></div><p>This can be fixed throughout the entire benchmark duration, or vary in a controlled way:</p><p><picture class="block"><source media="(prefers-color-scheme: light), (prefers-color-scheme: no-preference)" srcSet="https://planetscale-images.imgix.net/assets/open-closed-loop-B0_3fnSO.png?auto=compress%2Cformat"><source media="(prefers-color-scheme: dark)" srcSet="https://planetscale-images.imgix.net/assets/open-closed-loop-darkmode-CYoXgW5C.png?auto=compress%2Cformat"><img alt="Open vs Closed loop benchmark" src="https://planetscale-images.imgix.net/assets/open-closed-loop-B0_3fnSO.png?auto=compress%2Cformat" width="3172" height="1416" loading="lazy"></picture></p><p>Open-loop benchmarks tend to be more realistic. In production systems, database load is applied at the rate that the clients demand, regardless of how well the database is keeping up.</p><p>Closed-loop benchmarks are more commonly seen in academic and performance comparisons, as they offer a more controlled environment for comparing things like QPS across a fixed amount of concurrency.</p><p>Both are beneficial, but they are useful for different things. Important to decide up front what the purpose of a benchmark is, then choose the type accordingly.</p><h2 id="what-to-measure"><a href="https://planetscale.com/blog/on-benchmarking#what-to-measure">What to measure?</a></h2><p>Broadly, there are two things we like to measure when benchmarking: <em>throughput</em> and <em>latency</em>. Any good database benchmark will report on both of these things.</p><h2 id="throughput"><a href="https://planetscale.com/blog/on-benchmarking#throughput">Throughput</a></h2><p><em>Throughput</em> is the amount of work completed in a slice of time. In databases, the most common measures are Queries Per Second (QPS) or Transactions Per Second (TPS). For many popular benchmarks like <a href="https://www.tpc.org/tpcc/">TPC-C</a> and <a href="https://www.tpc.org/tpch/">TPC-H</a>, <code>TPS &lt; QPS</code> because there are typically multiple queries within single transactions. Either works fine as a measure.</p><p>To measure throughput, choose a workload, a period of time to run it for (say, 5 minutes / 300 seconds), and then execute with TPS / QPS sampling. As a benchmark runs, samples are taken of how many queries or transactions complete each second. We then display this as a graph, showing every collected data point:</p><p><picture class="block"><source media="(prefers-color-scheme: light), (prefers-color-scheme: no-preference)" srcSet="https://planetscale-images.imgix.net/assets/throughput-lines-DG3lJ36Y.png?auto=compress%2Cformat"><source media="(prefers-color-scheme: dark)" srcSet="https://planetscale-images.imgix.net/assets/throughput-lines-darkmode-B-LbVppT.png?auto=compress%2Cformat"><img alt="Throughput line chart" src="https://planetscale-images.imgix.net/assets/throughput-lines-DG3lJ36Y.png?auto=compress%2Cformat" width="3172" height="1416" loading="lazy"></picture></p><p>A more compact way of displaying this is via a bar chart with error bars.</p><p><picture class="block"><source media="(prefers-color-scheme: light), (prefers-color-scheme: no-preference)" srcSet="https://planetscale-images.imgix.net/assets/throughput-bars-DAVyhM1x.png?auto=compress%2Cformat"><source media="(prefers-color-scheme: dark)" srcSet="https://planetscale-images.imgix.net/assets/throughput-bars-darkmode-DRPfZNGr.png?auto=compress%2Cformat"><img alt="Throughput bar chart" src="https://planetscale-images.imgix.net/assets/throughput-bars-DAVyhM1x.png?auto=compress%2Cformat" width="2000" height="1340" loading="lazy"></picture></p><p>This communicates similar information in a more compact way, but it&#x27;s ideal to show a full line graph, as that also better visualizes inconsistencies or spikiness of performance throughout a benchmark run. More on this later.</p><p>Error bars are only one way to summarize variance. <a href="https://en.wikipedia.org/wiki/Coefficient_of_variation">Coefficient of variation</a>, <a href="https://en.wikipedia.org/wiki/Interquartile_range">interquartile range</a>, and <a href="https://en.wikipedia.org/wiki/Histogram">histograms</a> are different lenses on the same samples, each helping show whether a benchmark was stable, noisy, or hiding outliers. It&#x27;s helpful to include these or provide the data so readers can compute them themselves.</p><p>Throughput only tells half the story.</p><h2 id="latency"><a href="https://planetscale.com/blog/on-benchmarking#latency">Latency</a></h2><p><em>Latency</em> is the amount of time it takes to complete an operation, query, or transaction. We can look at individual latencies (&quot;How long did this particular <code>SELECT * FROM...</code> take?&quot;), but more often we assess latencies in aggregate.</p><p>The standard language for communicating about latencies in distributed systems is with <em>percentiles</em> over some span of time (1 second, 1 minute, etc.). For example:</p><ul><li>p50 - The median latency. During this time period, half of the requests executed faster than this, the other half slower.</li><li>p90 - The 90th percentile. During this time period, 9 out of 10 requests executed faster, 1 out of 10 slower.</li><li>p99 - The 99th percentile. During this time period, 99 out of 100 requests executed faster, 1 out of 100 slower.</li></ul><p>We can measure any latency percentile we want, but these are the most common, along with p95 and p99.9. When benchmarking, we typically measure one or more of these in a series of small windows over the entire benchmark period. Say, sample p50, p90, and p99 once per second over a 5-minute (300-second) execution. Then, we plot the results.</p><p><picture class="block"><source media="(prefers-color-scheme: light), (prefers-color-scheme: no-preference)" srcSet="https://planetscale-images.imgix.net/assets/latency-lines-BNBoL30i.png?auto=compress%2Cformat"><source media="(prefers-color-scheme: dark)" srcSet="https://planetscale-images.imgix.net/assets/latency-lines-darkmode-BI3lGrIV.png?auto=compress%2Cformat"><img alt="Latency line chart" src="https://planetscale-images.imgix.net/assets/latency-lines-BNBoL30i.png?auto=compress%2Cformat" width="3208" height="1416" loading="lazy"></picture></p><p>In some cases, the line graphs are overkill. As with throughput, the visual can be compressed using a bar chart showing the median (or mean), with error bars.</p><p><picture class="block"><source media="(prefers-color-scheme: light), (prefers-color-scheme: no-preference)" srcSet="https://planetscale-images.imgix.net/assets/latency-bars-D6X_kFOI.png?auto=compress%2Cformat"><source media="(prefers-color-scheme: dark)" srcSet="https://planetscale-images.imgix.net/assets/latency-bars-darkmode-DtAqZb6n.png?auto=compress%2Cformat"><img alt="Latency bar chart" src="https://planetscale-images.imgix.net/assets/latency-bars-D6X_kFOI.png?auto=compress%2Cformat" width="2000" height="1380" loading="lazy"></picture></p><p>We now have a way of communicating both <em>how much work</em> we accomplished and <em>how quickly</em> each unit of work was completed.</p><h2 id="warmup"><a href="https://planetscale.com/blog/on-benchmarking#warmup">Warmup</a></h2><p>We&#x27;ve now settled the prep work and know <em>what</em> we should be measuring. Now let&#x27;s get tactical. How do we ensure that we are fair when running the benchmark? There&#x27;s a lot to consider for the executions themselves.</p><p>A big one is cache warmup. If we&#x27;ve recently booted up our database, the various caches are not full of pages (<code>buffer_cache</code> in Postgres, <code>buffer_pool</code> in MySQL). These require time and query load to warm, during which time latency and throughput will slowly be brought up to full potential.</p><p><picture class="block"><source media="(prefers-color-scheme: light), (prefers-color-scheme: no-preference)" srcSet="https://planetscale-images.imgix.net/assets/warming-CmzsXHI3.png?auto=compress%2Cformat"><source media="(prefers-color-scheme: dark)" srcSet="https://planetscale-images.imgix.net/assets/warming-darkmode-BPg8wwcI.png?auto=compress%2Cformat"><img alt="Cache warming in databases" src="https://planetscale-images.imgix.net/assets/warming-CmzsXHI3.png?auto=compress%2Cformat" width="3172" height="1416" loading="lazy"></picture></p><p>We typically run databases without measurement for a few minutes to ensure all caches are <em>warmed</em> before starting benchmark measurement. This ensures non-full caches and other startup costs don&#x27;t impact the numbers.</p><h2 id="configuration"><a href="https://planetscale.com/blog/on-benchmarking#configuration">Configuration</a></h2><p>Even when warm, there are a number of configuration options that impact performance over long stretches of time. Though there are many, a good example of this is <code>checkpoint_timeout</code> in Postgres.</p><p>This and <code>max_wal_size</code> determine how frequently we need to flush table / index changes to disk (I/O checkpointing). If we set these to low / aggressive values, we may trigger it once every minute, causing regular performance dips. If we set it lax to only trigger once every ten minutes, we may not even notice it in the results of a 5-minute benchmark execution.</p><p><picture class="block"><source media="(prefers-color-scheme: light), (prefers-color-scheme: no-preference)" srcSet="https://planetscale-images.imgix.net/assets/checkpoints-DPQC9Z0v.png?auto=compress%2Cformat"><source media="(prefers-color-scheme: dark)" srcSet="https://planetscale-images.imgix.net/assets/checkpoints-darkmode-BWJJBKrU.png?auto=compress%2Cformat"><img alt="Checkpointing in database benchmarks" src="https://planetscale-images.imgix.net/assets/checkpoints-DPQC9Z0v.png?auto=compress%2Cformat" width="3172" height="1416" loading="lazy"></picture></p><p>We can end up with graphs like this in these cases. But run for another 10 minutes, and we&#x27;d likely see a large performance dip on the green line.</p><p>Background jobs, I/O checkpointing, autovacuum, and other work can impact the throughput, skewing the benchmark results.</p><p>It&#x27;s important to consider the impact database configurations have on performance. An identical benchmark on the same hardware can perform very differently with different tunings. DBMSs give us these tunings so we can trade off things like performance, durability, data size, and resource consumption on a case-by-case basis. It&#x27;s generally best to either (a) ensure all configuration options are aligned or (b) for pre-tuned situations (like most database-as-a-service providers) leave things at the pre-tuned defaults.</p><h2 id="inconsistency"><a href="https://planetscale.com/blog/on-benchmarking#inconsistency">(In)consistency</a></h2><p>Another important consideration, especially in the cloud, is (in)consistency. Even with the same benchmark instance and same client machine, latency and throughput can vary from run to run. This can be due to contention on the network or noisy neighbors that are co-occupying the same hardware you are running on.</p><p><picture class="block"><source media="(prefers-color-scheme: light), (prefers-color-scheme: no-preference)" srcSet="https://planetscale-images.imgix.net/assets/repeating-DBCnml8x.png?auto=compress%2Cformat"><source media="(prefers-color-scheme: dark)" srcSet="https://planetscale-images.imgix.net/assets/repeating-darkmode-BqI9nytL.png?auto=compress%2Cformat"><img alt="Repeating the same benchmark" src="https://planetscale-images.imgix.net/assets/repeating-DBCnml8x.png?auto=compress%2Cformat" width="3172" height="1416" loading="lazy"></picture></p><p>It&#x27;s advisable to do multiple runs to measure consistency.</p><h2 id="apples-to-apples-to-oranges"><a href="https://planetscale.com/blog/on-benchmarking#apples-to-apples-to-oranges">Apples to apples to oranges</a></h2><p>The best benchmarks are the ones that compare apples-to-apples. In other words, ones that create data-driven comparisons between products that have the same or very similar characteristics and feature sets.</p><p>Examples of this are:</p><ul><li>Comparing 4 different Postgres configurations to determine workload suitability</li><li>Comparing 3 different cloud MySQL platforms to determine which is most performant</li><li>Comparing MySQL and Postgres on an identical workload (different databases, but same stated purpose)</li></ul><p>People sometimes draw comparisons between vastly different database engines, resulting in wild claims. Things like:</p><ul><li>Analytics queries run 100x faster on Apache Pinot than Postgres</li><li>Achieve 100x higher QPS on a purpose-built realtime database compared to a Postgres relational database</li><li>SQLite latency is 80% lower than MySQL</li></ul><p>These are comparing databases that were distinctly optimized for different purposes. It&#x27;s easy to make one look better than the other, especially when cherry-picking the workload.</p><p>Don&#x27;t do this. Ensure comparisons are between comparable technologies and workloads that fit the DBMS&#x27;s stated purpose. The one exception may be as an internal test to determine which technology, amongst ones with vastly different goals, is best-suited for a system.</p><h2 id="document-everything"><a href="https://planetscale.com/blog/on-benchmarking#document-everything">Document everything</a></h2><p>Good benchmarks should be reproducible. Document the client and target setups as exhaustively as possible: hardware (or cloud instance type), OS, software versions, build flags, configurations, benchmark tool, exact command line, etc. After looking at the results of a benchmark, an engineer should be able to reproduce the results.</p><h2 id="benchmark-crimes"><a href="https://planetscale.com/blog/on-benchmarking#benchmark-crimes">Benchmark crimes</a></h2><p>As you can see, there&#x27;s a lot to good benchmarking. Missing any one of these steps leads to bias. Some of the most common mistakes:</p><ul><li>Reporting only averages, without percentiles, variance, or the full time-series</li><li>Leaving out hardware, instance type, etc.</li><li>Measuring before the system reaches steady state</li><li>Reporting a percentage difference without the surrounding variance</li><li>Forgetting to check whether the benchmark client is the bottleneck</li></ul><p>That last one is easy to miss!</p><p>If the client machine has maxed out on CPU or network connections, the graph may look like the database has plateaued. But all you&#x27;ve really measured is the limit of the load generator.</p><h2 id="go-forth-and-benchmark"><a href="https://planetscale.com/blog/on-benchmarking#go-forth-and-benchmark">Go forth and benchmark</a></h2><p>You now have an elementary understanding of database benchmarking.</p><p>When presenting results, don&#x27;t stop at the numbers. If two runs differ meaningfully, offer a hypothesis for why: hardware, configuration, workload shape, cache behavior, network latency, or something else. The reader should not have to invent the causal story themselves.</p><p>Apply all these to your next round of benchmarks, and you&#x27;re less likely to veer off-course.</p>]]></content>
    <summary><![CDATA[Benchmarking is hard. Done wrong it is very misleading, and unfortunately it is frequently done wrong. Let's explore how not to make silly mistakes.]]></summary>
  </entry>
</feed>